
The No-Brainer Framework
How to Stop Scoring Projects and Start Making Strategic Decisions

Foreword
Every organization faces the same fundamental challenge: too many projects, too few resources, and no defensible method to choose between them.
What follows is not another scoring template. It is a decision architecture, a structured way of thinking about portfolio composition that makes trade-offs visible, quantifies strategic alignment, and forces honest conversations about what your organization actually values.
This framework emerged from a simple observation: the projects that transform companies look nothing like the projects that sustain them. Treating them identically is not just analytically lazy, it is strategically dangerous.

Part I: The Problem Worth Solving
The Portfolio Prioritization Crisis
Most organizations do not lack ideas. They lack a defensible method to choose between them.
In the absence of structured prioritization, project selection defaults to three dysfunctional modes. The first is political: whoever has the loudest voice or the most organizational capital wins. The second is emotional: projects that feel urgent crowd out projects that are genuinely important. The third is arbitrary: decisions are made in hallways, based on incomplete information, by whoever happens to be in the room.
The consequences are predictable. Resources scatter across too many initiatives. Strategic projects starve while tactical work proliferates. Capability investments, the infrastructure, platforms, and systems that enable future growth, are perpetually deferred because their value is harder to articulate than next quarter’s revenue target.
This is not a process problem. It is a thinking problem. And it requires a different mental model.
Why Traditional ROI Fails
Return on investment remains the default language of project justification. It offers the comfort of a single number and the illusion of objectivity. But ROI systematically distorts portfolio decisions in three ways.
First, it privileges the measurable over the meaningful. A customer acquisition campaign has a clear revenue forecast; a data platform does not. The campaign wins the budget, and the organization wonders why it cannot execute on its “data-driven strategy.”
Second, it ignores strategic alignment. Two projects with identical ROI projections might have radically different strategic implications, one reinforcing a dying business model, the other opening new market possibilities. ROI treats them as equivalent.
Third, it assumes certainty where none exists. The precision of ROI calculations creates false confidence. A project showing 340% return is not three times more valuable than one showing 110%. Both numbers are educated guesses wrapped in spreadsheet formatting.
The framework presented here does not abandon financial analysis. It contextualizes it within a broader strategic assessment that acknowledges uncertainty, values optionality, and distinguishes between fundamentally different project types.
Part II: The Core Framework
The Foundational Insight: Initiatives vs. Enablers
The framework begins with a recognition that most organizations implicitly understand but rarely formalize: not all projects are the same kind of thing.
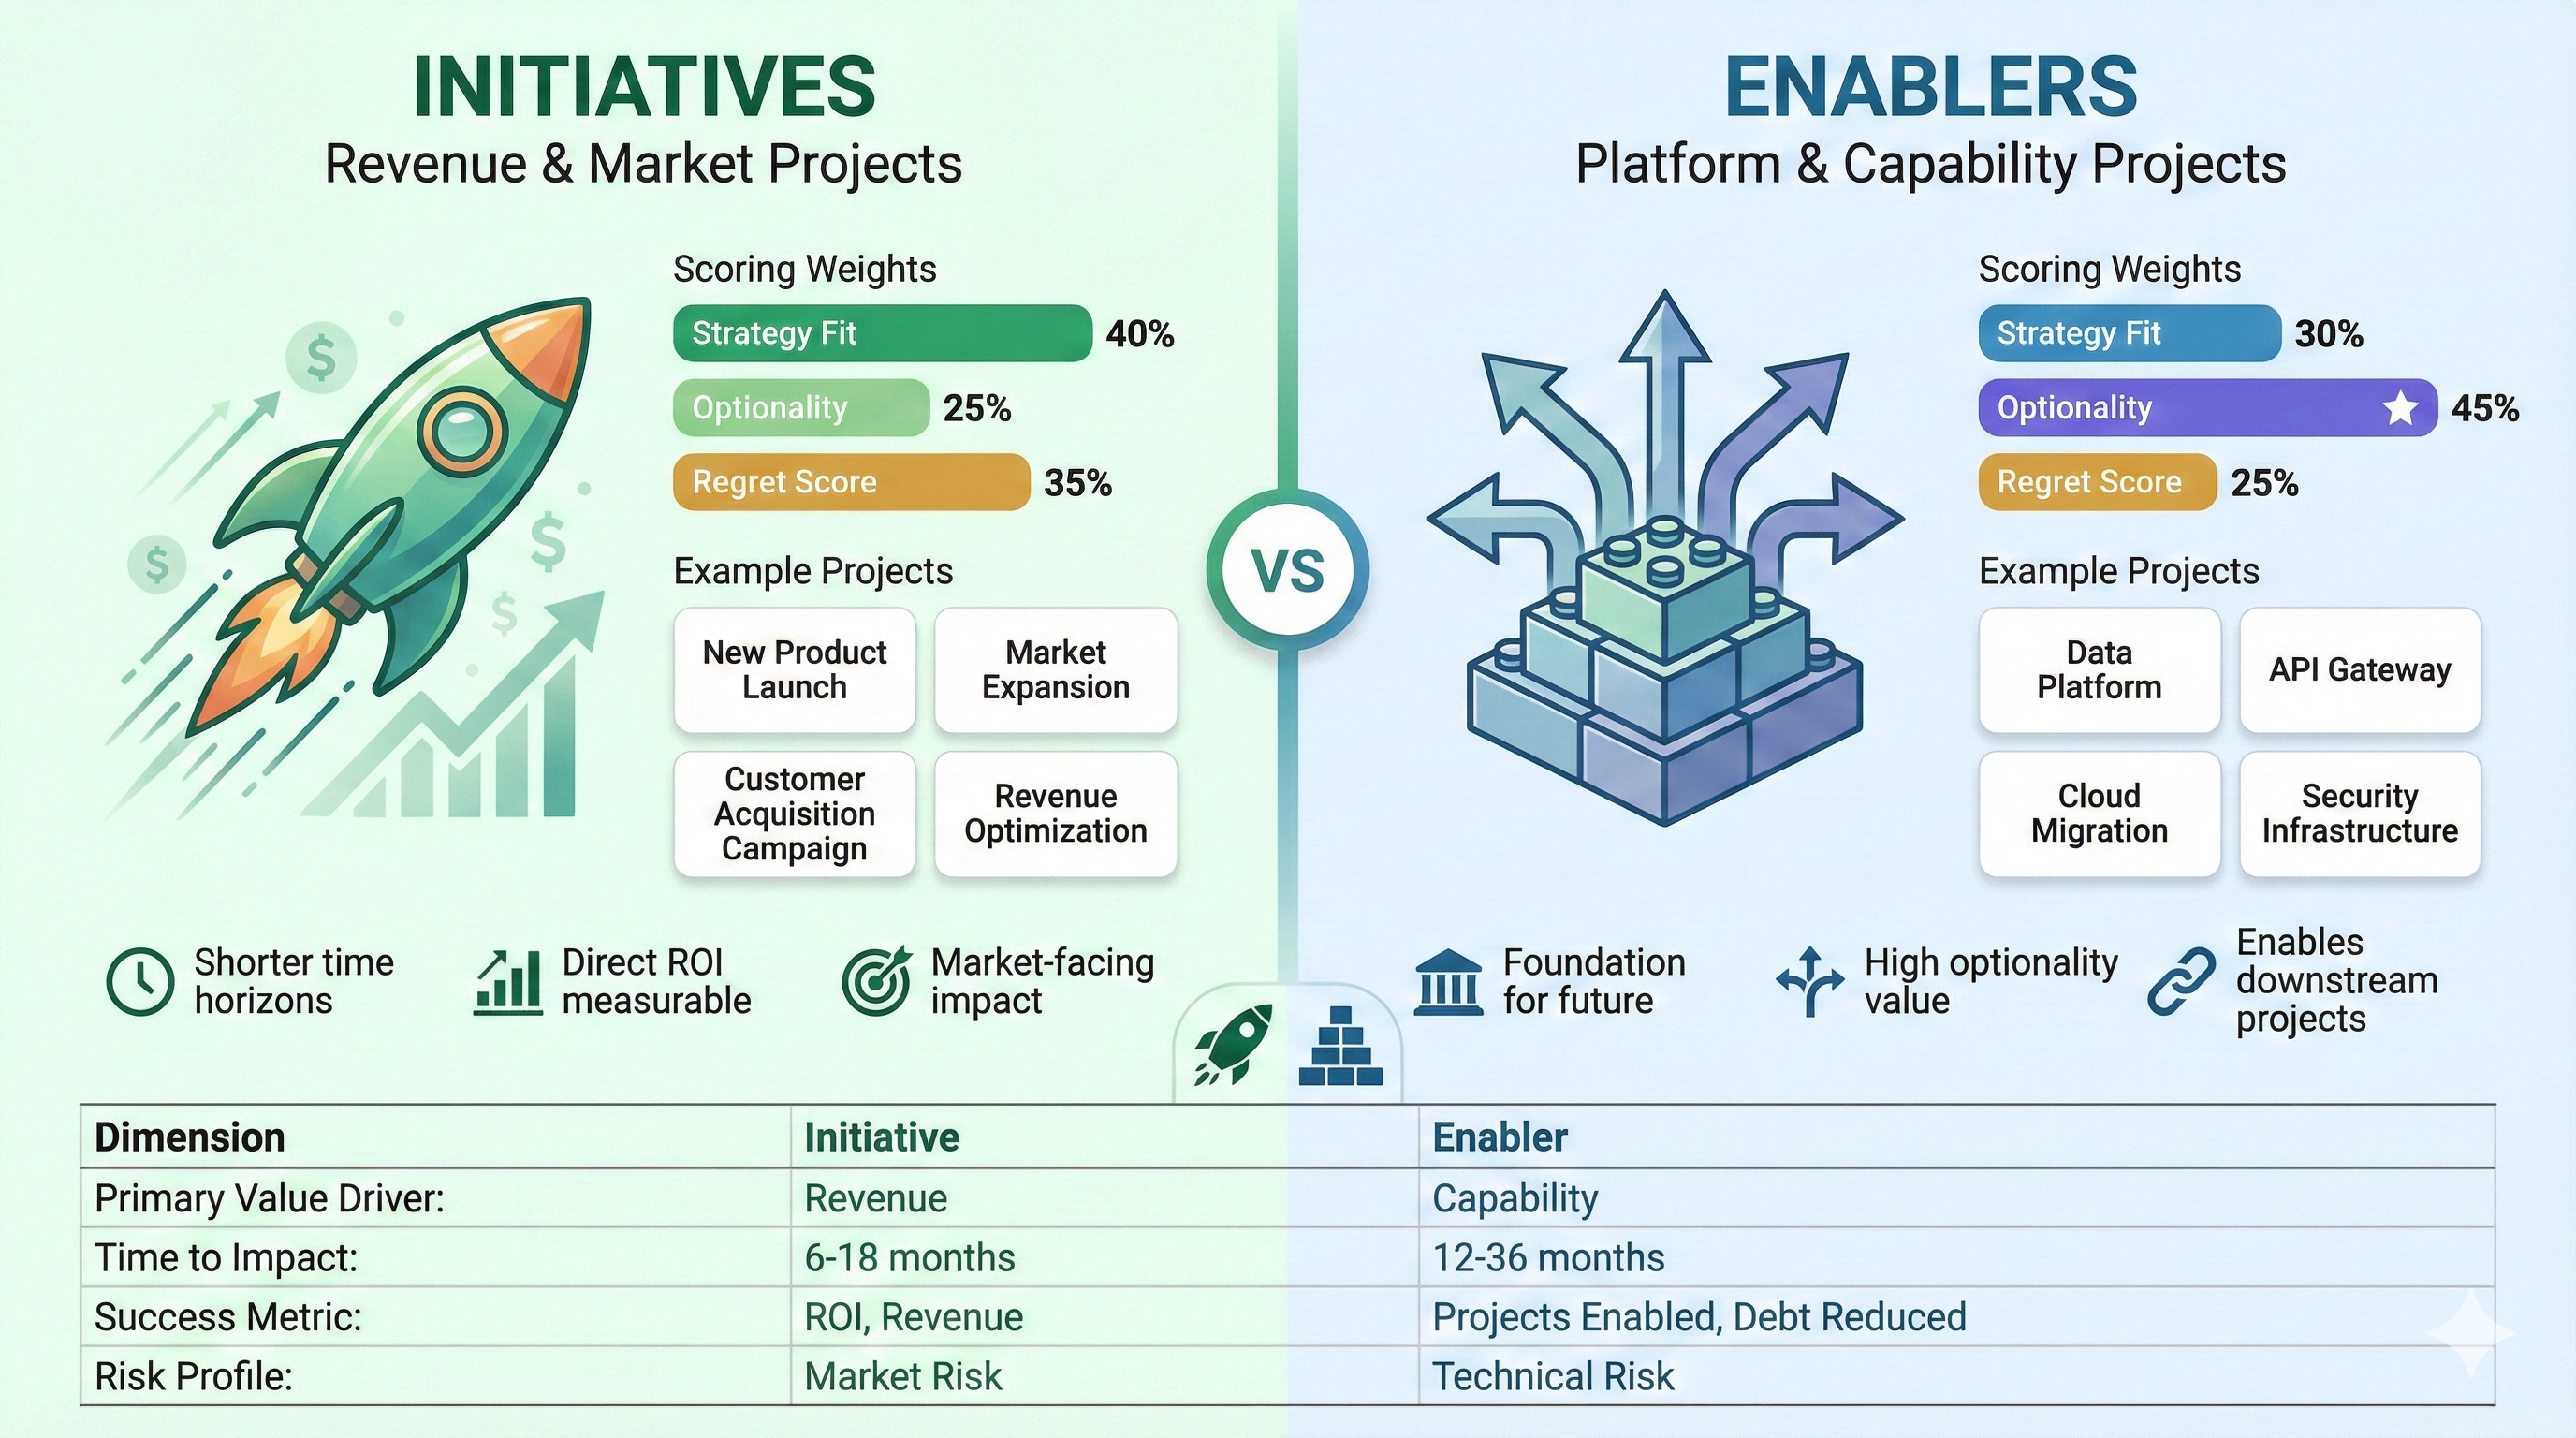
An Initiative is a project with direct, measurable impact on revenue, market position, or customer outcomes. A new product launch, a market expansion, a sales enablement program, draw these are Initiatives. Their value proposition is relatively straightforward: we invest X, we expect to generate Y.
An Enabler is fundamentally different. It is an investment in capability, infrastructure, or platform that creates the conditions for future Initiatives to succeed. A cloud migration, an API gateway, a data governance program - these are Enablers. Their value is not in what they directly produce, but in what they make possible.
The strategic error most organizations make is evaluating these two project types using identical criteria. An Enabler will always lose to an Initiative in a pure ROI competition, because its returns are indirect and distributed across future projects that may not yet exist. This is not a flaw in the Enabler but a flaw in the evaluation method.
The Three Strategic Dimensions
Traditional project scoring focuses on financial return and implementation effort. This framework adds three dimensions that capture strategic value more completely.
Strategy Fit
Strategy Fit measures the degree to which a project advances declared strategic priorities. The emphasis on “declared” is intentional. Every organization has two strategies: the one in the PowerPoint deck and the one revealed by resource allocation. This dimension forces alignment between aspiration and investment.
A project scores highest when it directly enables a top strategic priority, not tangentially related, not “aligned with our values,” but specifically advancing a named strategic objective. Moderate scores indicate general thematic alignment. Low scores signal projects that may be valuable but are not strategically essential.
The discipline this dimension imposes is significant. It requires that strategy be articulated clearly enough to evaluate projects against it. Vague strategies produce vague prioritization.
Optionality
Optionality captures a project’s contribution to future flexibility. Some projects close doors; others open them. A narrow point solution solves one problem and nothing else. A platform investment creates the foundation for applications not yet conceived.
This dimension matters most for Enablers. A data platform with a high Optionality score is not only infrastructure but strategic capital, expanding the organization’s ability to respond to future opportunities. The framework weights Optionality more heavily for Enablers precisely because this future-oriented value is their primary contribution.
For Initiatives, Optionality measures market position implications. Does this product launch open adjacent markets? Does this customer segment provide learning that transfers elsewhere? High-optionality Initiatives create strategic momentum beyond their immediate returns.
Regret Score
The Regret Score inverts the typical value calculation. Instead of asking “what do we gain by doing this?”, it asks “what do we lose by not doing this?”
This reframing activates loss aversion, a cognitive bias that makes potential losses loom larger than equivalent gains. A project that seems modestly attractive as an opportunity can become urgently necessary when framed as a loss.
The Regret Score surfaces existential risks, competitive threats, and strategic windows that may close. It forces the question: three years from now, if we did not do this, how much would we regret that decision?
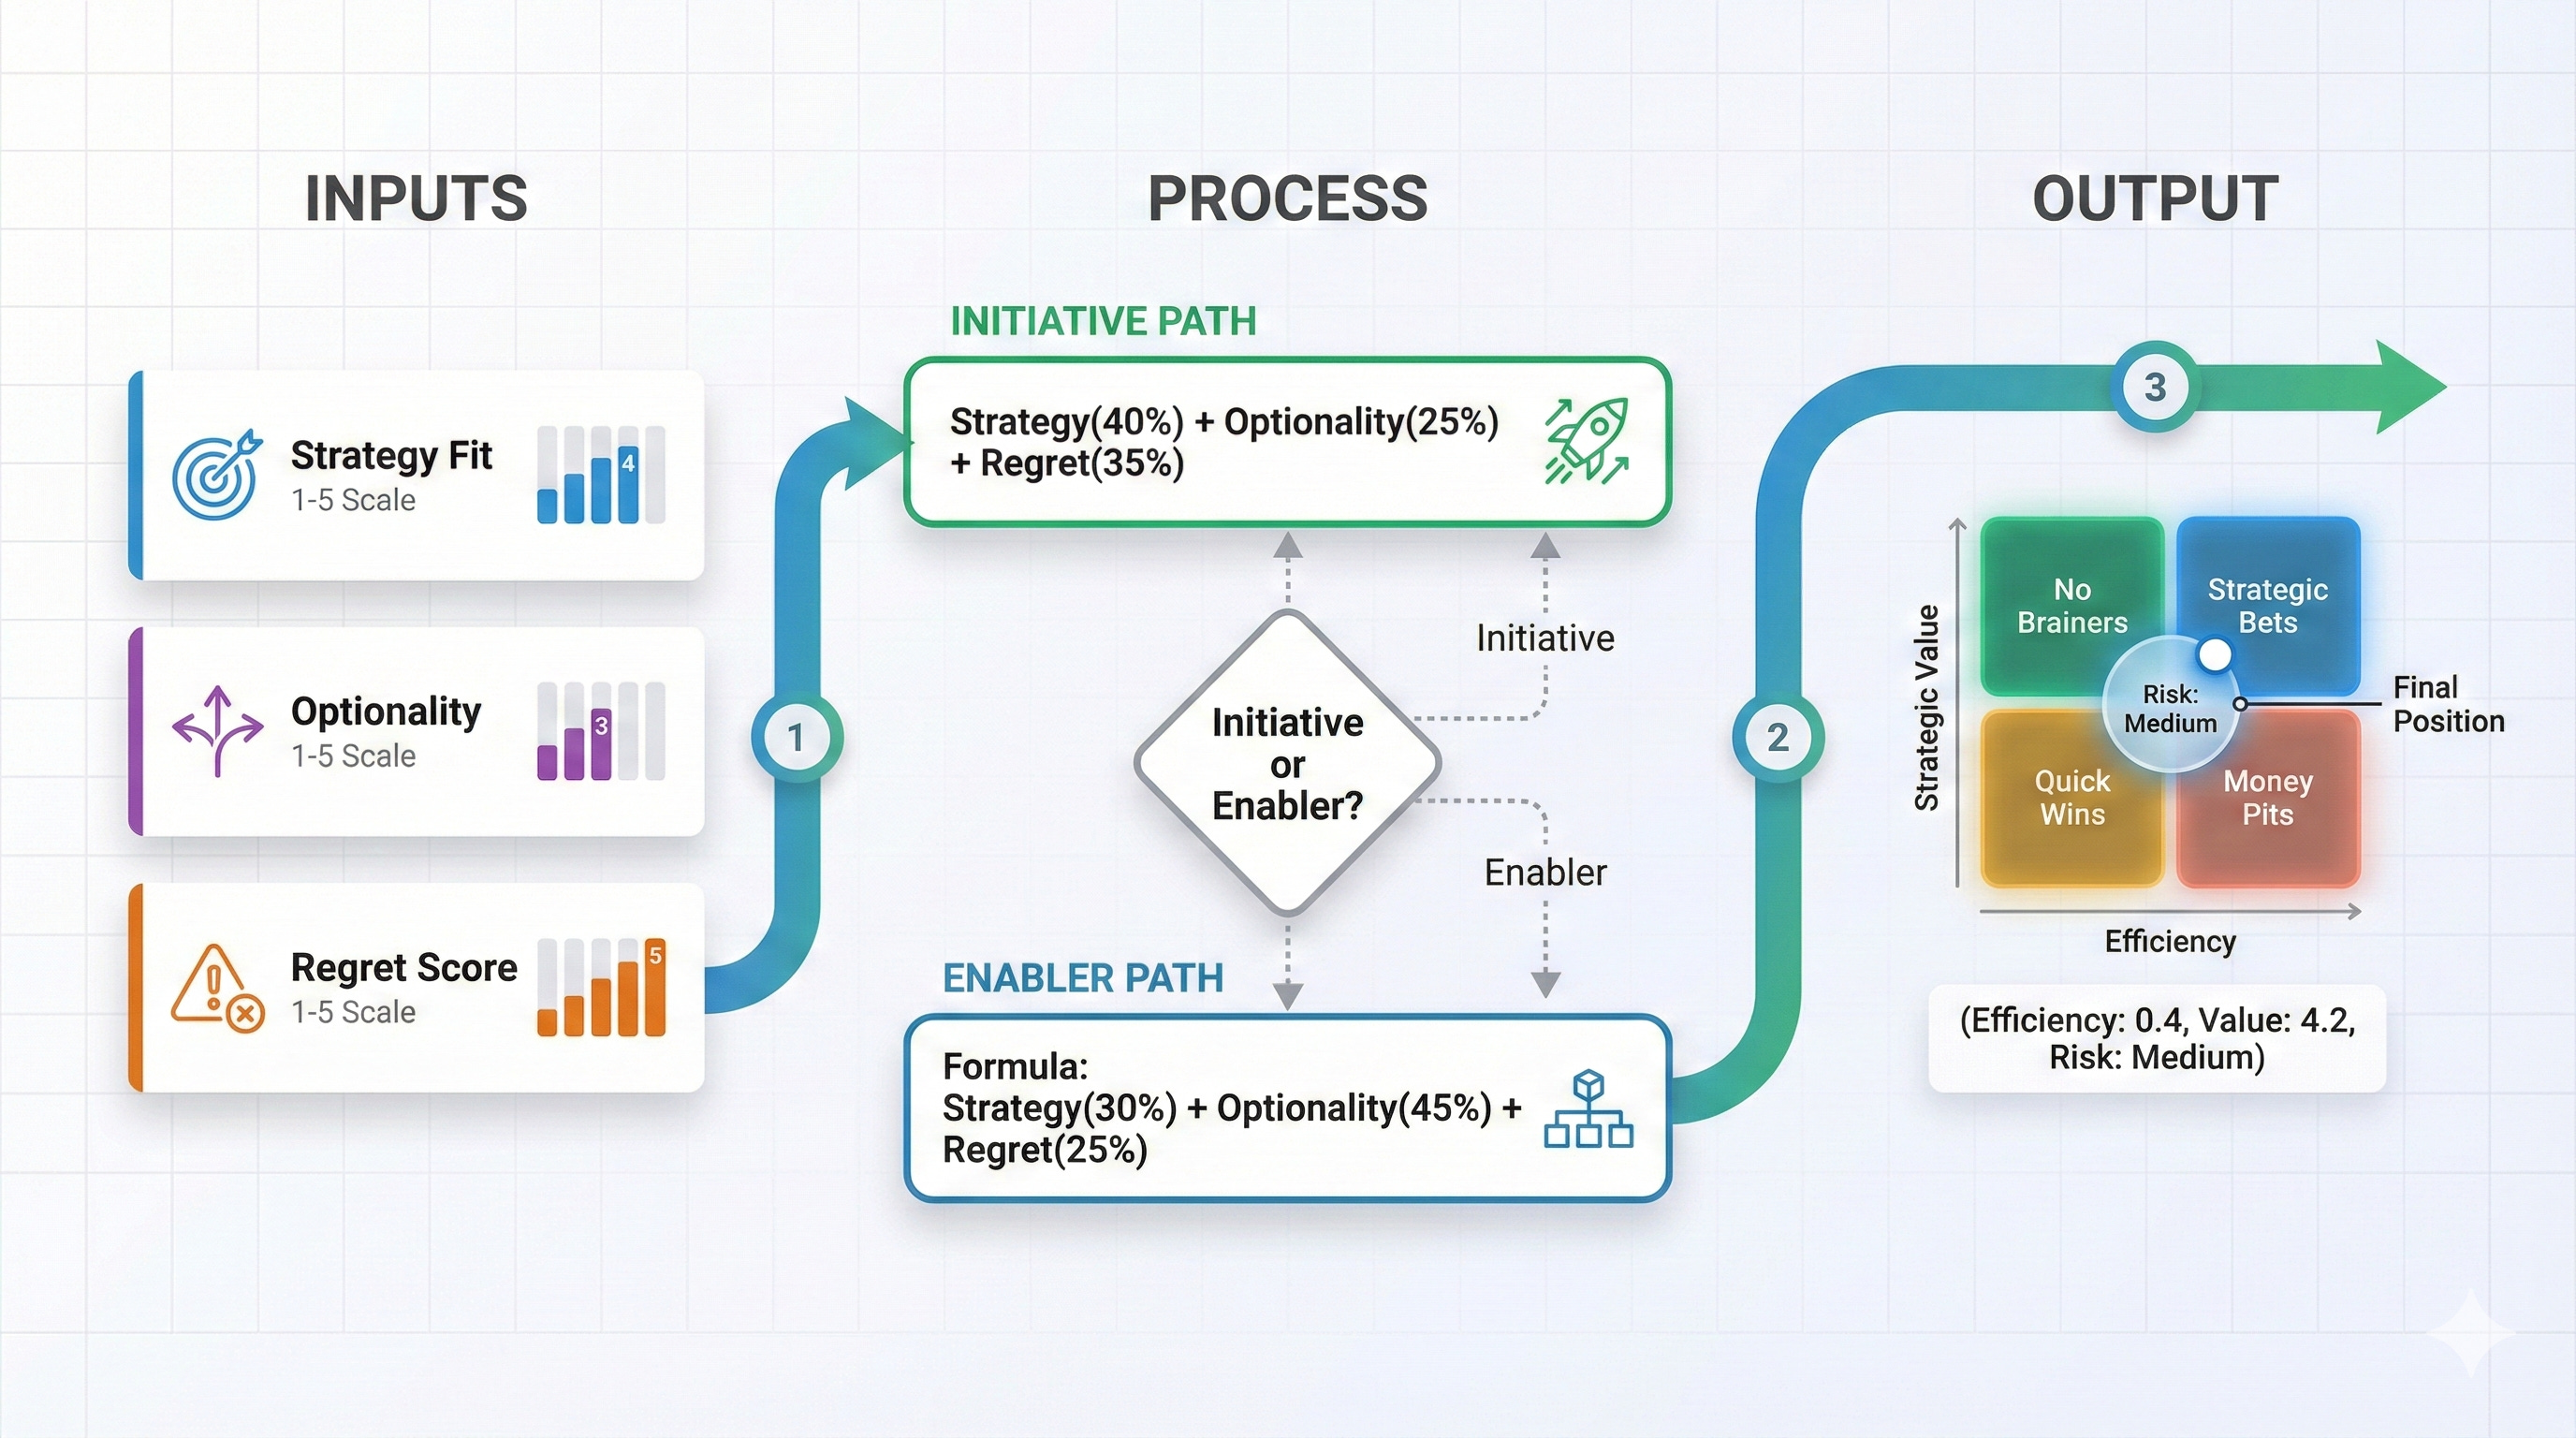
The Scoring Formulas
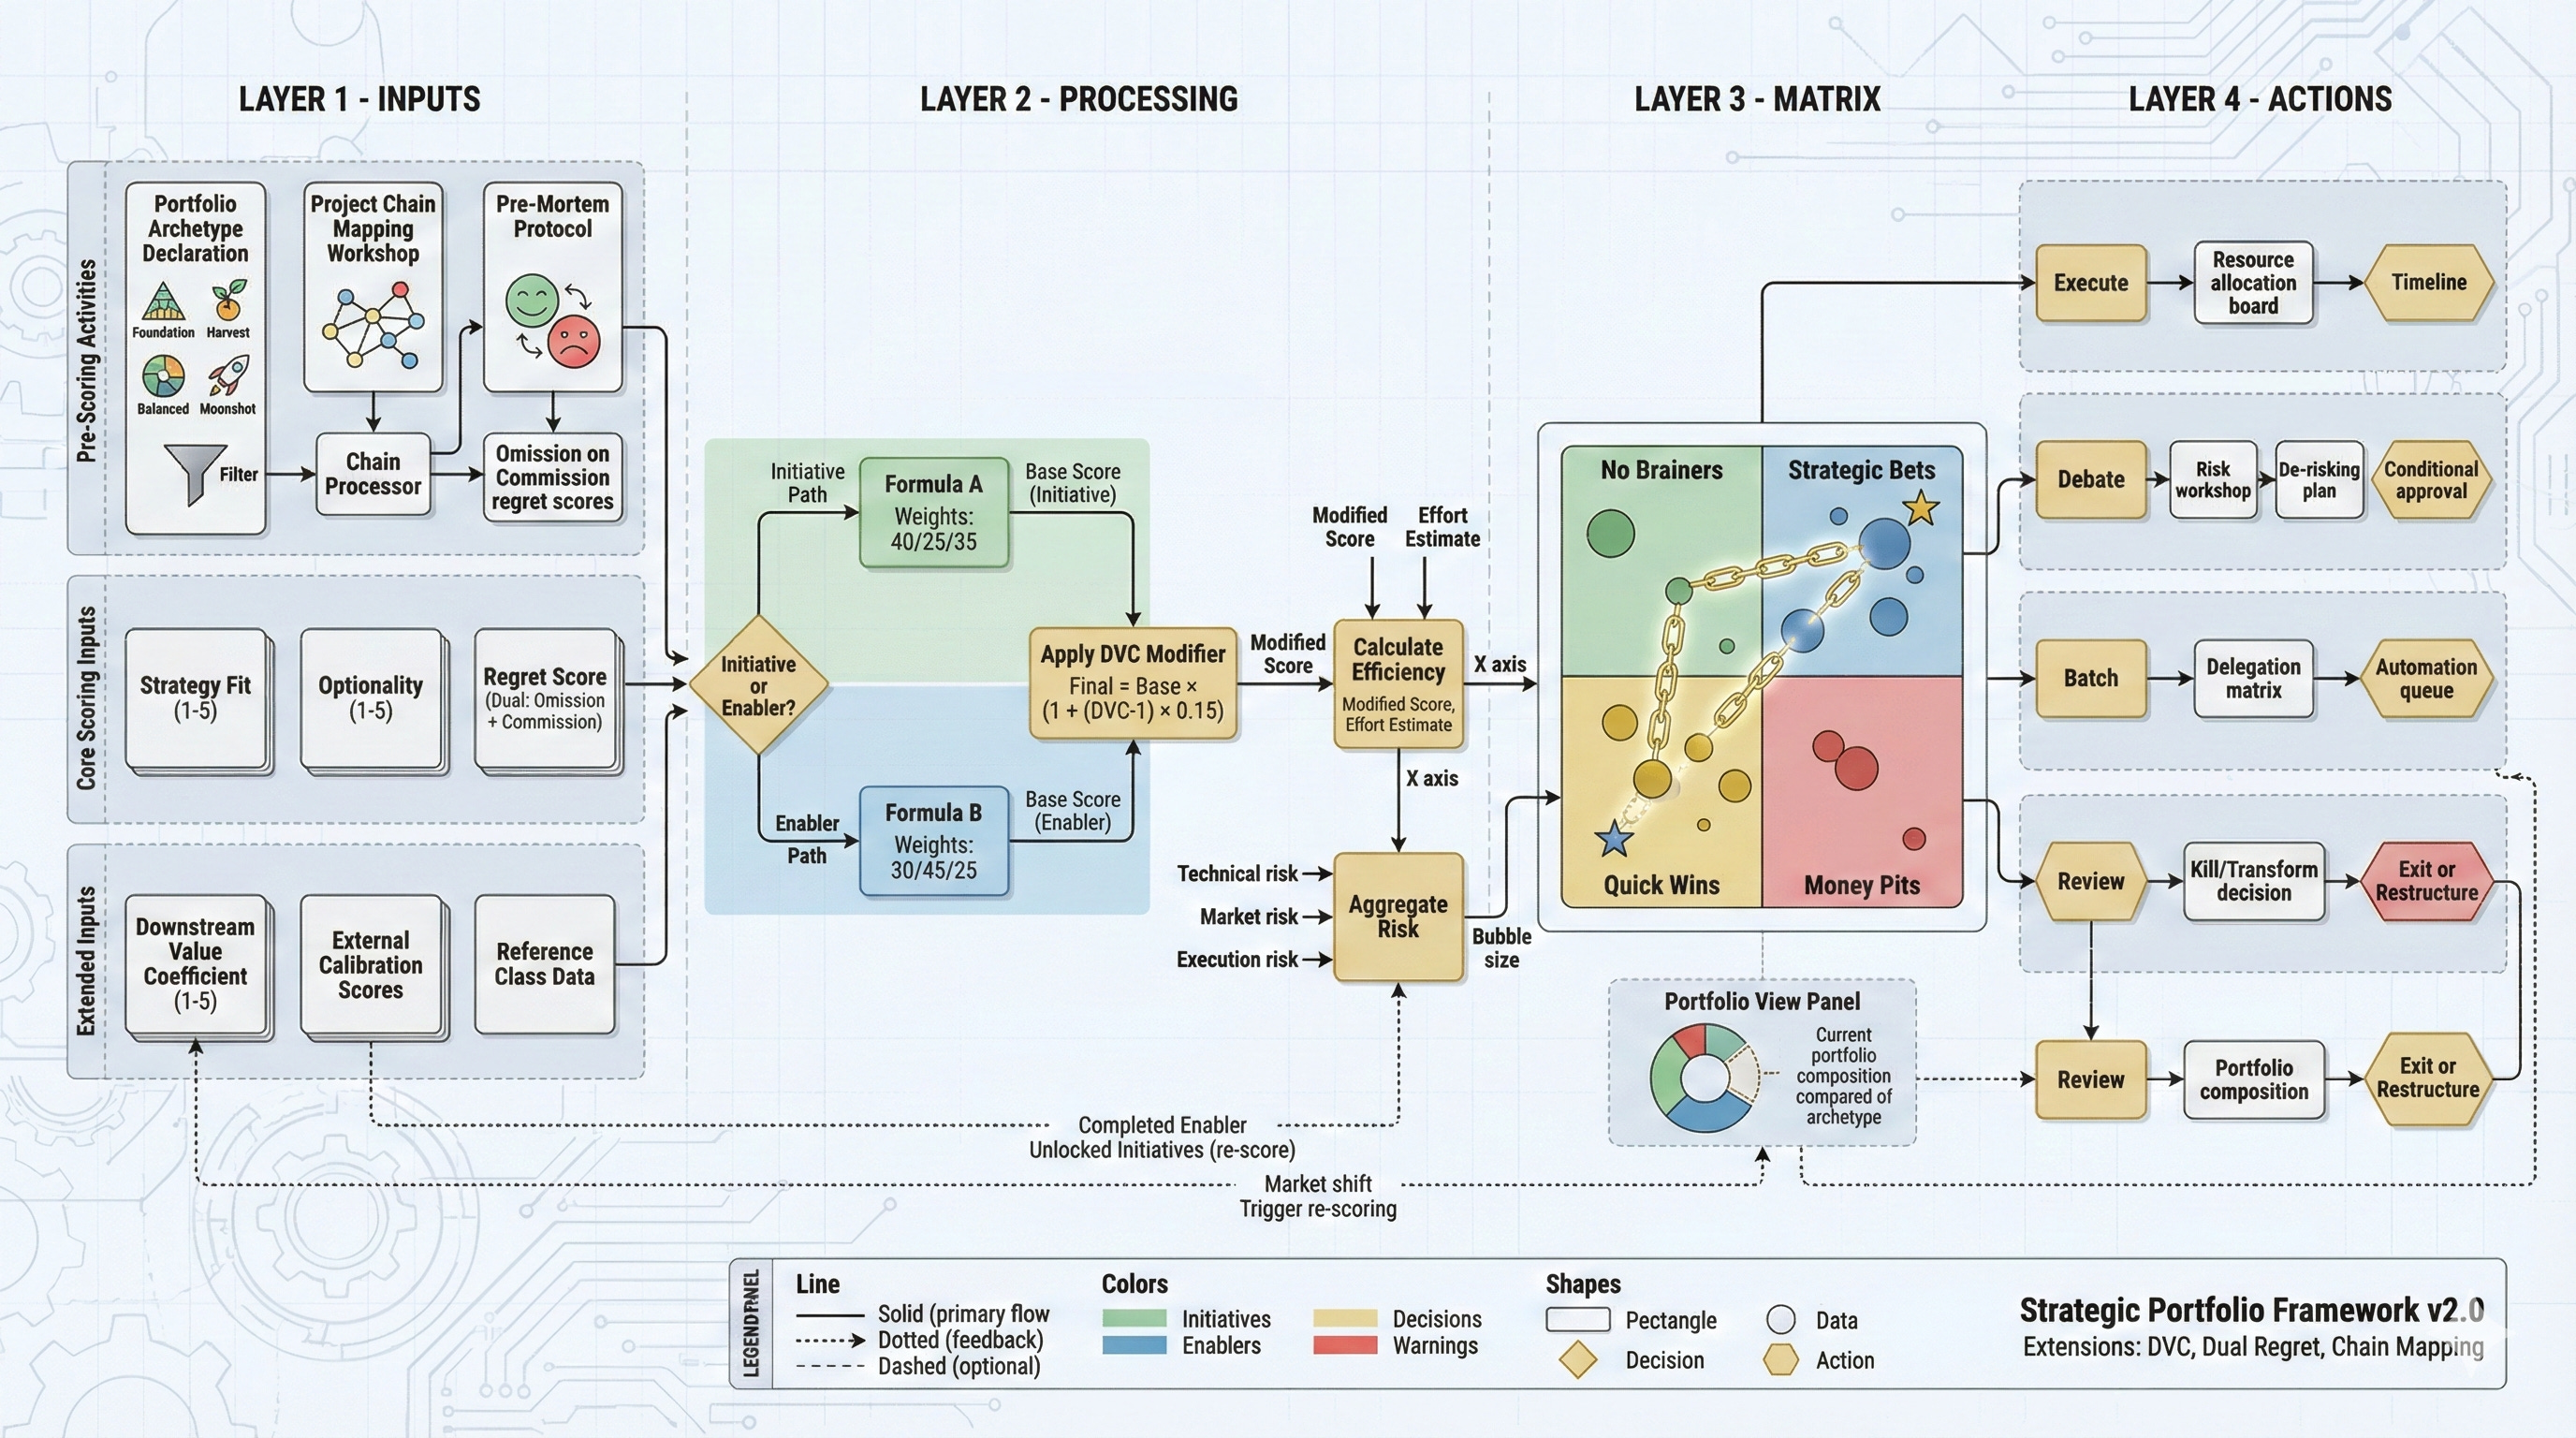
The three dimensions combine into a Strategic Value score using differentiated weightings for each project type.
For Initiatives, the formula emphasizes Strategy Fit and Regret, with Optionality as a secondary consideration. This reflects their nature as execution vehicles for current strategy:
Strategic Value (Initiative) = Strategy Fit × 0.40 + Optionality × 0.25 + Regret Score × 0.35
For Enablers, the formula elevates Optionality to the primary weight, recognizing that their strategic value lies in future capability creation:
Strategic Value (Enabler) = Strategy Fit × 0.30 + Optionality × 0.45 + Regret Score × 0.25
The difference is not cosmetic. An Enabler with high Optionality but modest Strategy Fit; say, a flexible integration platform that supports multiple future use cases without directly advancing current priorities; Gib will score appropriately under the Enabler formula. Under the Initiative formula, it would be systematically undervalued.
Efficiency is calculated separately, relating adjusted value to implementation effort. For Initiatives, this is relatively straightforward ROI analysis. For Enablers, Efficiency incorporates downstream value, the aggregate worth of projects that the Enabler makes possible.
The final output is a coordinate position on the Strategic Portfolio Matrix, with bubble size encoding risk level.
Part III: The Strategic Portfolio Matrix
Reading the Matrix
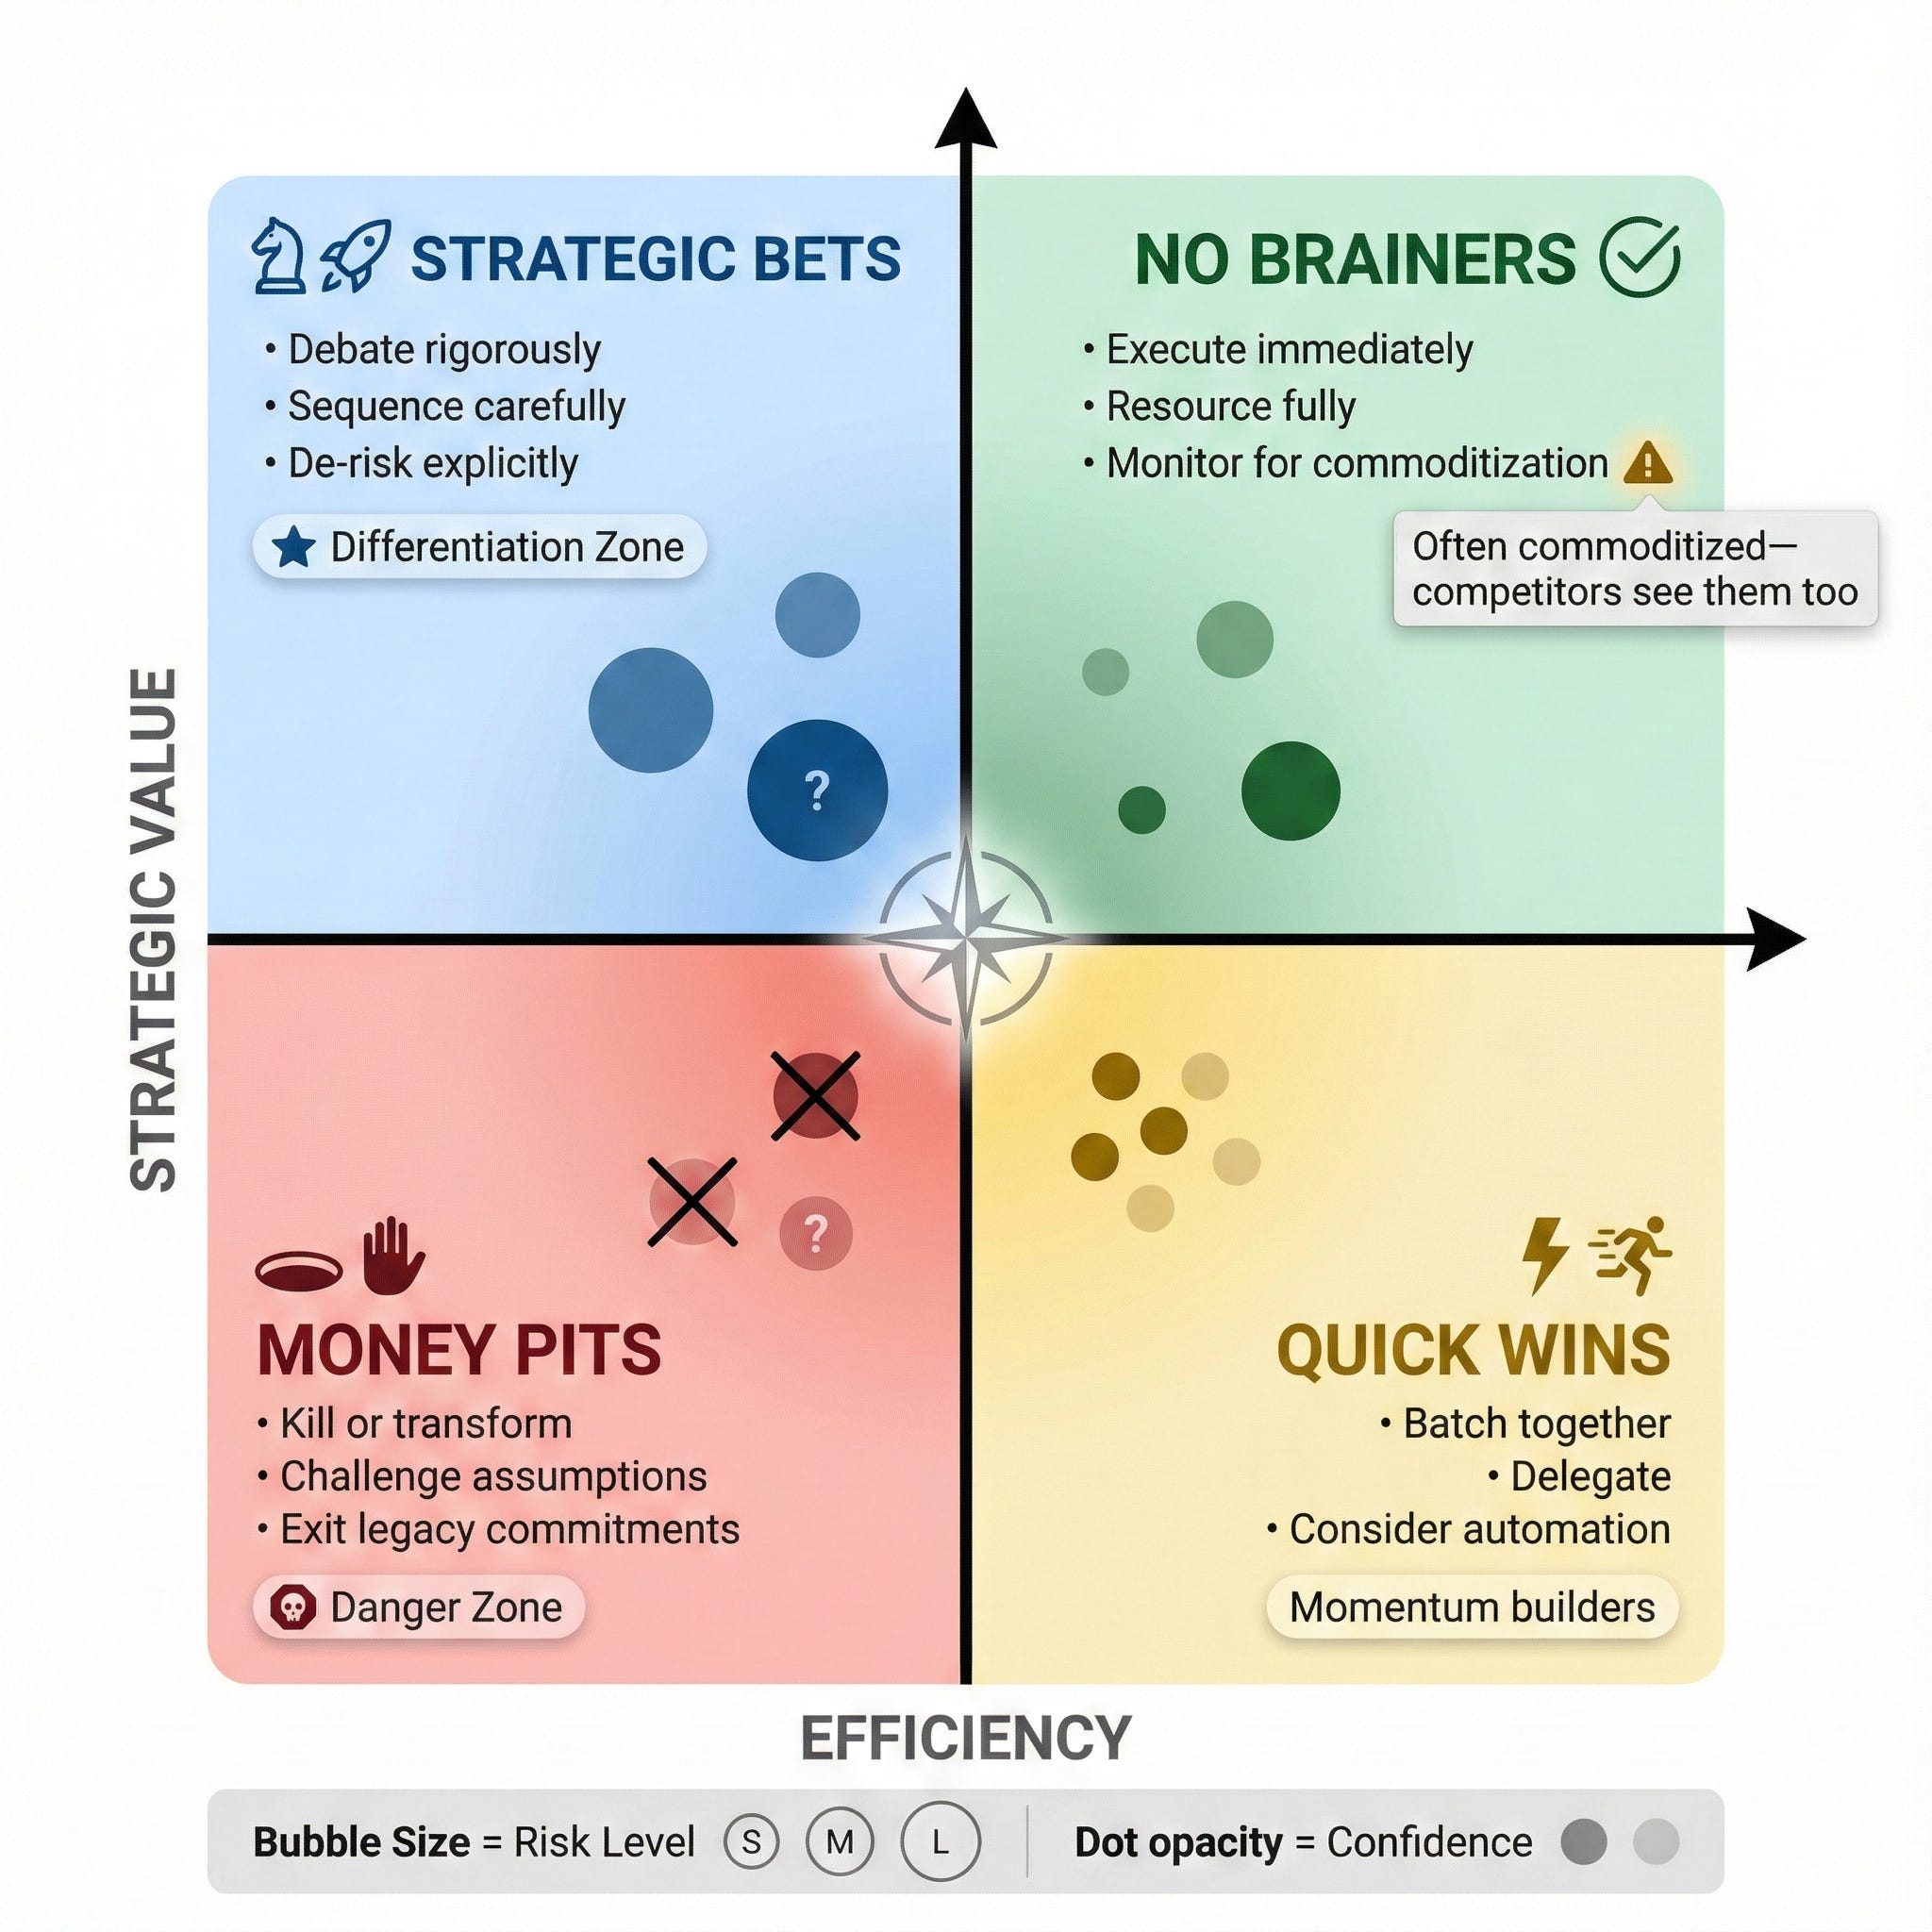
The matrix plots projects along two axes. The vertical axis represents Strategic Value: the weighted composite of Strategy Fit, Optionality, and Regret. The horizontal axis represents Efficiency, the ratio of value to effort.
This produces four quadrants, each with distinct characteristics and required responses.
No Brainers: High Value, High Efficiency
The upper-right quadrant contains projects that combine strategic importance with favorable economics. These are obvious investments, hence the name.
The leadership response is straightforward: execute immediately and resource fully. Do not overthink these decisions; speed of execution is often the primary variable.
However, a warning accompanies this quadrant. No Brainer projects are frequently visible to competitors. If the opportunity is obvious to you, it is probably obvious to others. Execution speed and quality become the differentiators, not strategic insight.
Strategic Bets: High Value, Low Efficiency
The upper-left quadrant contains the most consequential decisions in the portfolio. These are projects with significant strategic importance but challenging economics: high investment, long timelines, uncertain returns.
Strategic Bets require different treatment than any other quadrant. They deserve rigorous debate, not quick approval. They require explicit de-risking strategies, milestone-based commitment, and often phased investment.
Most importantly, Strategic Bets are often the only path to genuine differentiation. The projects that competitors cannot easily replicate, because they are too expensive, too complex, or too long-term, live in this quadrant. Organizations that avoid Strategic Bets entirely may optimize short-term efficiency while sacrificing long-term competitive position.
Quick Wins: Low Value, High Efficiency
The lower-right quadrant contains easy projects with modest strategic impact. These are the low-hanging fruit. Pleasant to harvest but not the basis of a nutrition strategy.
Quick Wins have legitimate uses. They build organizational momentum, demonstrate competence, satisfy stakeholder expectations, and free up capacity from tactical work. The appropriate treatment is batching, delegation, and where possible, automation.
The danger is portfolio creep. Quick Wins are seductive precisely because they are easy. Without discipline, they crowd out higher-value work. A portfolio dominated by Quick Wins is an organization optimizing for comfort rather than impact.
Money Pits: Low Value, Low Efficiency
The lower-left quadrant contains projects that consume significant resources without strategic justification. In theory, these projects should not exist. In practice, they are often the hardest to kill.
Money Pits typically have one of three origins. Some are legacy commitments, projects that made sense once but no longer do, yet continue through organizational inertia. Some are political favorites, projects championed by powerful stakeholders regardless of merit. Some are failed experiments that no one has the courage to terminate.
The required response is honest evaluation. Challenge every assumption. Require explicit justification for continuation. Consider radical transformation rather than incremental improvement. And when appropriate, have the executive courage to kill projects that no longer serve the organization.
Using the Matrix for Portfolio Decisions
Individual project positions are informative, but the matrix reveals its full value when viewing the portfolio as a whole.
A healthy portfolio has representation across quadrants, weighted according to strategic context. An organization in transformation mode will concentrate investments in Strategic Bets. An organization harvesting existing capabilities will lean toward No Brainers and Quick Wins. The matrix makes these portfolio shapes visible.
More importantly, the matrix surfaces portfolio imbalances. An organization that sees only Quick Wins and Money Pits has lost strategic ambition. An organization with only Strategic Bets may have prioritized vision over execution. The visual pattern prompts strategic conversation.
Part IV: Framework Extensions
The core framework provides robust prioritization for most contexts. The extensions that follow address specific gaps that emerge in sophisticated portfolio management.
The Downstream Value Coefficient
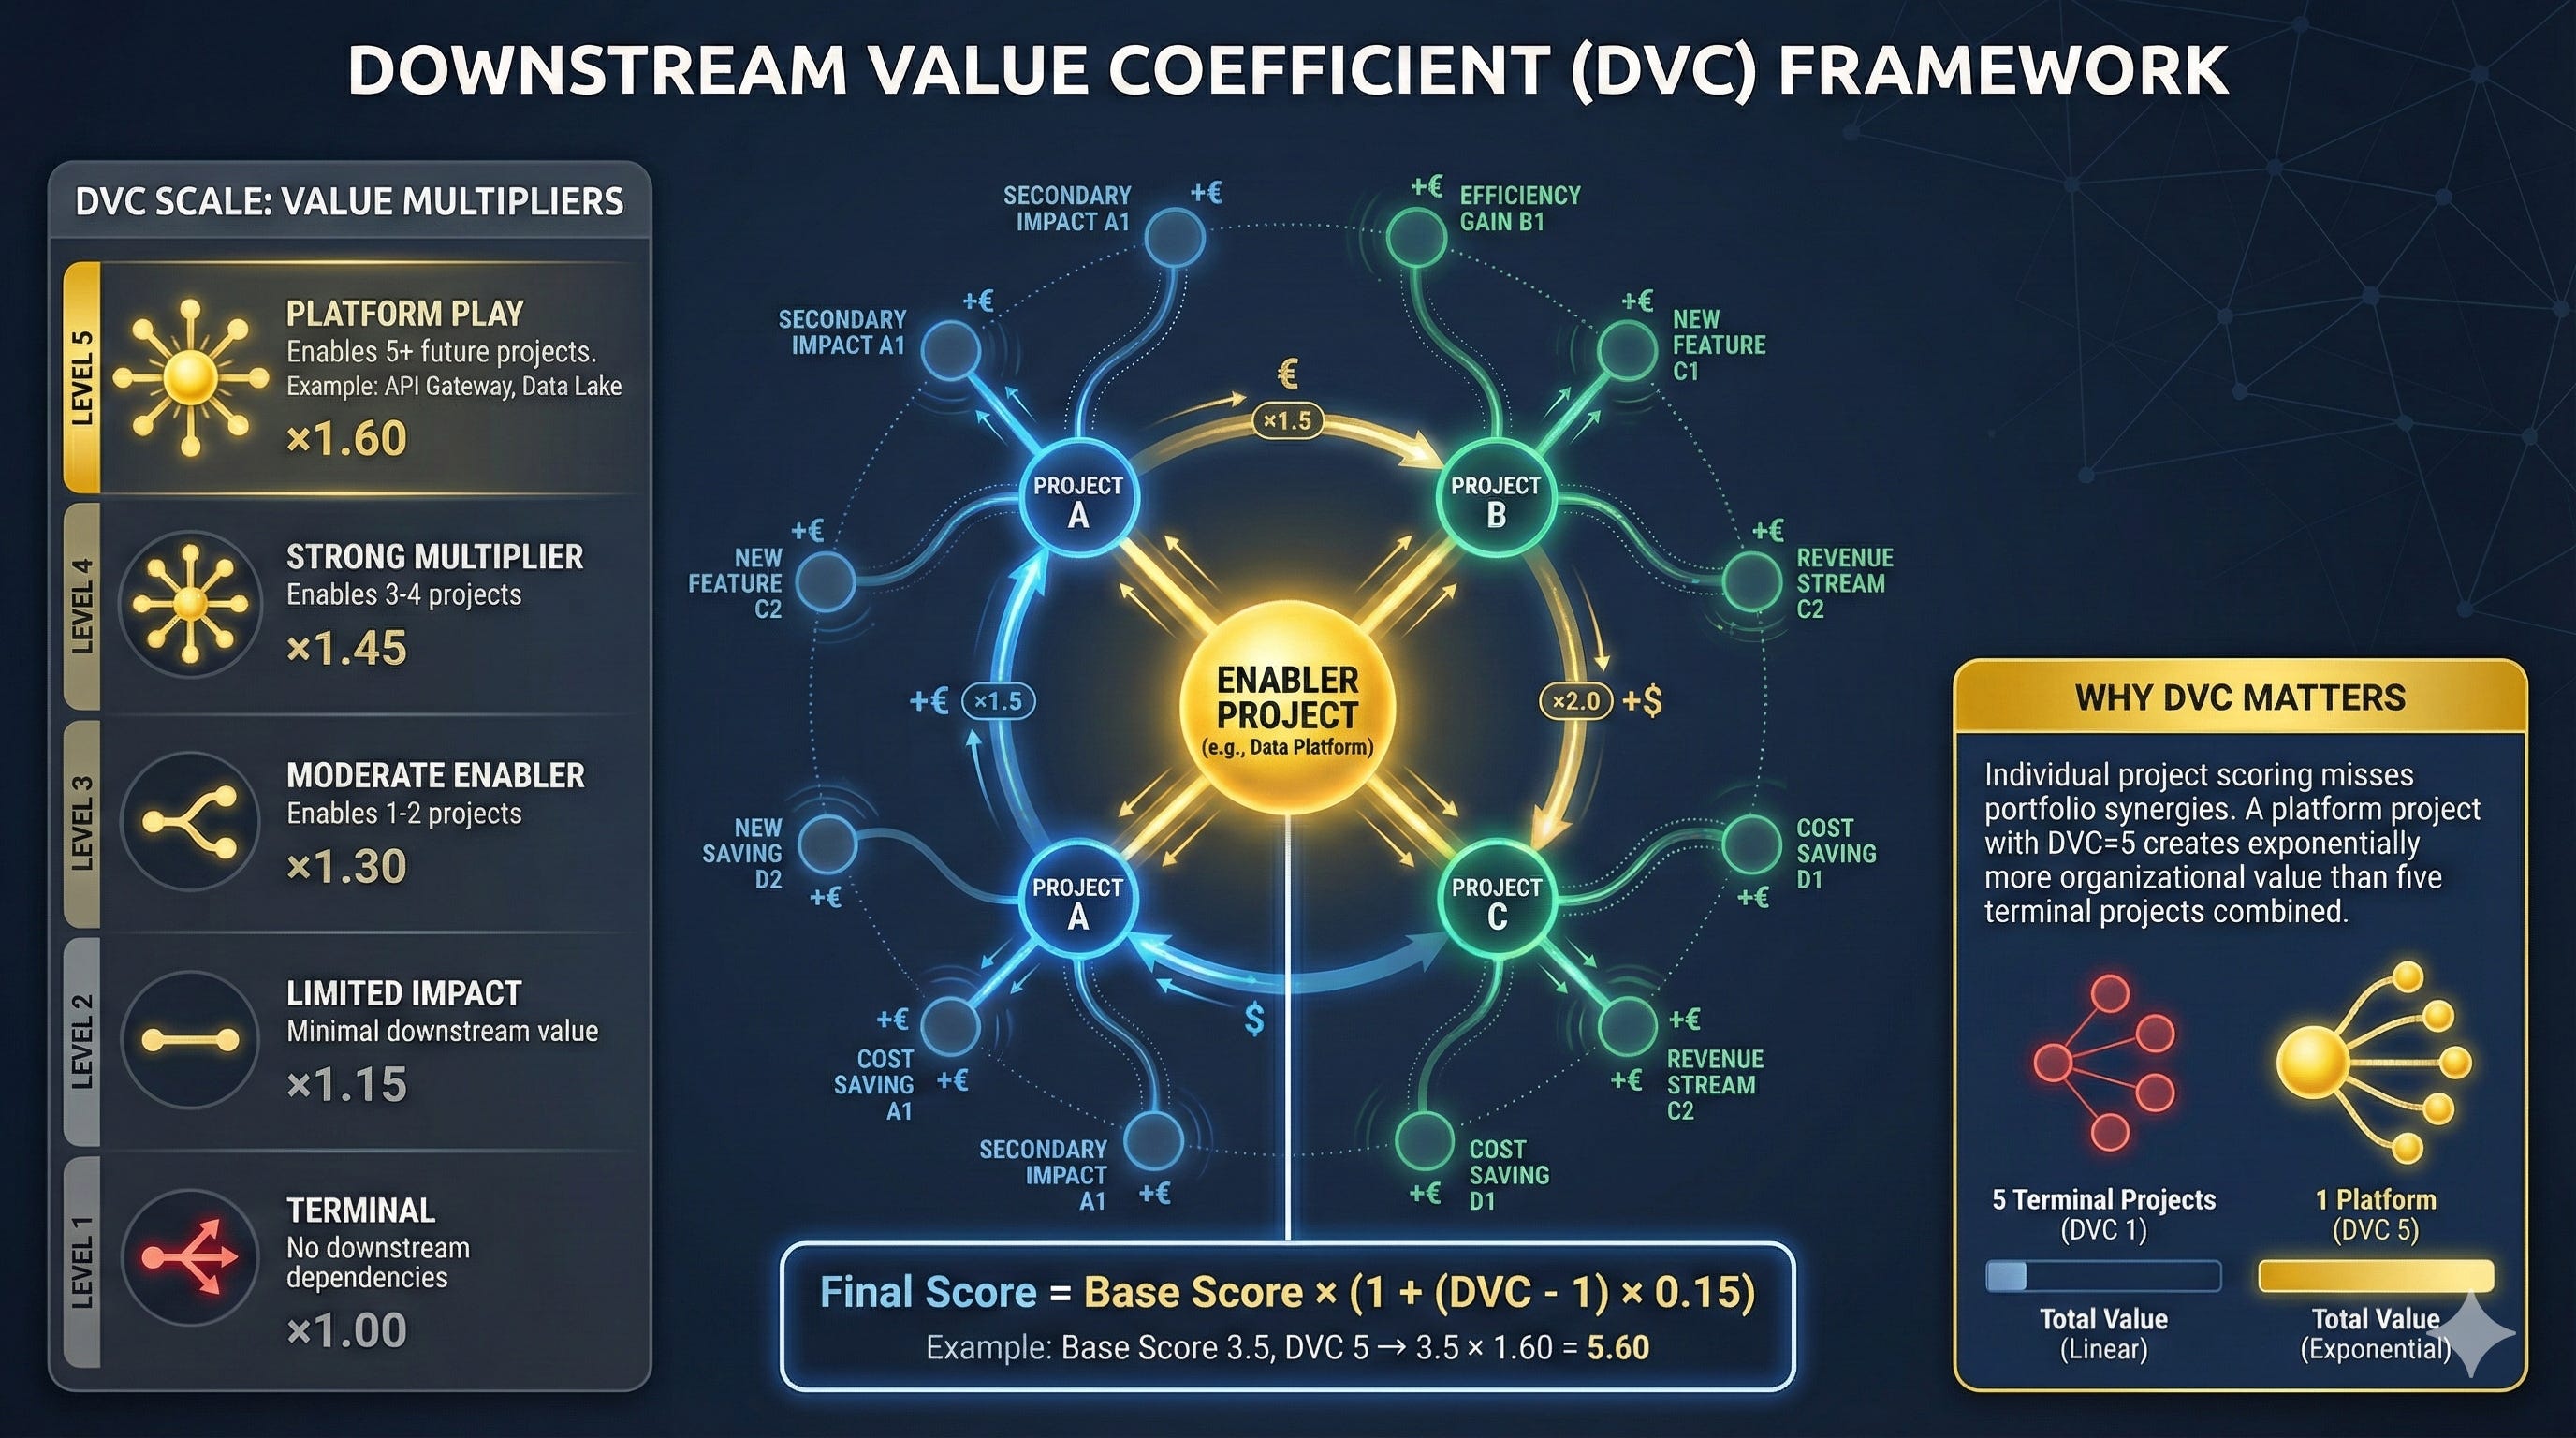
The Problem
Project scoring treats each initiative as independent. But portfolios contain dependencies. An Enabler that unlocks five downstream Initiatives is worth more than its standalone score suggests. The core framework misses this portfolio dynamic.
The Solution
The Downstream Value Coefficient (DVC) quantifies a project’s role in the broader portfolio ecosystem. Projects are scored on a 1-5 scale based on their enabling effect:
A score of 5 indicates a platform play: a foundational investment that enables five or more future projects. Data platforms, API gateways, and core system modernizations typically qualify.
A score of 3 indicates moderate enablement, one or two downstream dependencies. Specific integrations or capability extensions fit here.
A score of 1 indicates a terminal project and no downstream dependencies. One-off implementations or isolated improvements.
The coefficient modifies the base score: a project with DVC of 5 receives a 60% score boost; DVC of 3 yields a 30% boost; DVC of 1 leaves the score unchanged.
The Implication
Organizations that ignore downstream value systematically underinvest in platforms. They approve individual applications while starving the infrastructure that would make those applications better, faster, and cheaper. The DVC corrects this bias by making platform value explicit and quantifiable.
Project Chain Mapping
The Problem
Projects exist in sequences. An Initiative cannot launch until its enabling platform is complete. A platform cannot deliver value until the downstream applications are built. Approving projects individually, without understanding their dependencies, creates stranded investments and broken strategies.
The Solution
Before individual scoring begins, the organization maps project dependencies. This pre-scoring workshop identifies four chain types.
Sequential chains connect projects that must execute in order: A enables B, B enables C. The decision rule is uncompromising: approve the full chain or nothing. Approving C without committing to A is strategic fiction.
Enabling hubs show platform projects that support multiple downstream Initiatives. The hub’s score incorporates the aggregate value of everything it enables.
Accelerating relationships capture projects that speed other projects without hard dependency. A DevOps investment accelerates feature delivery; this acceleration factors into efficiency calculations.
Competing alternatives mark mutually exclusive paths. Build versus buy, Platform A versus Platform B. These require explicit trade-off decisions, not independent scoring.
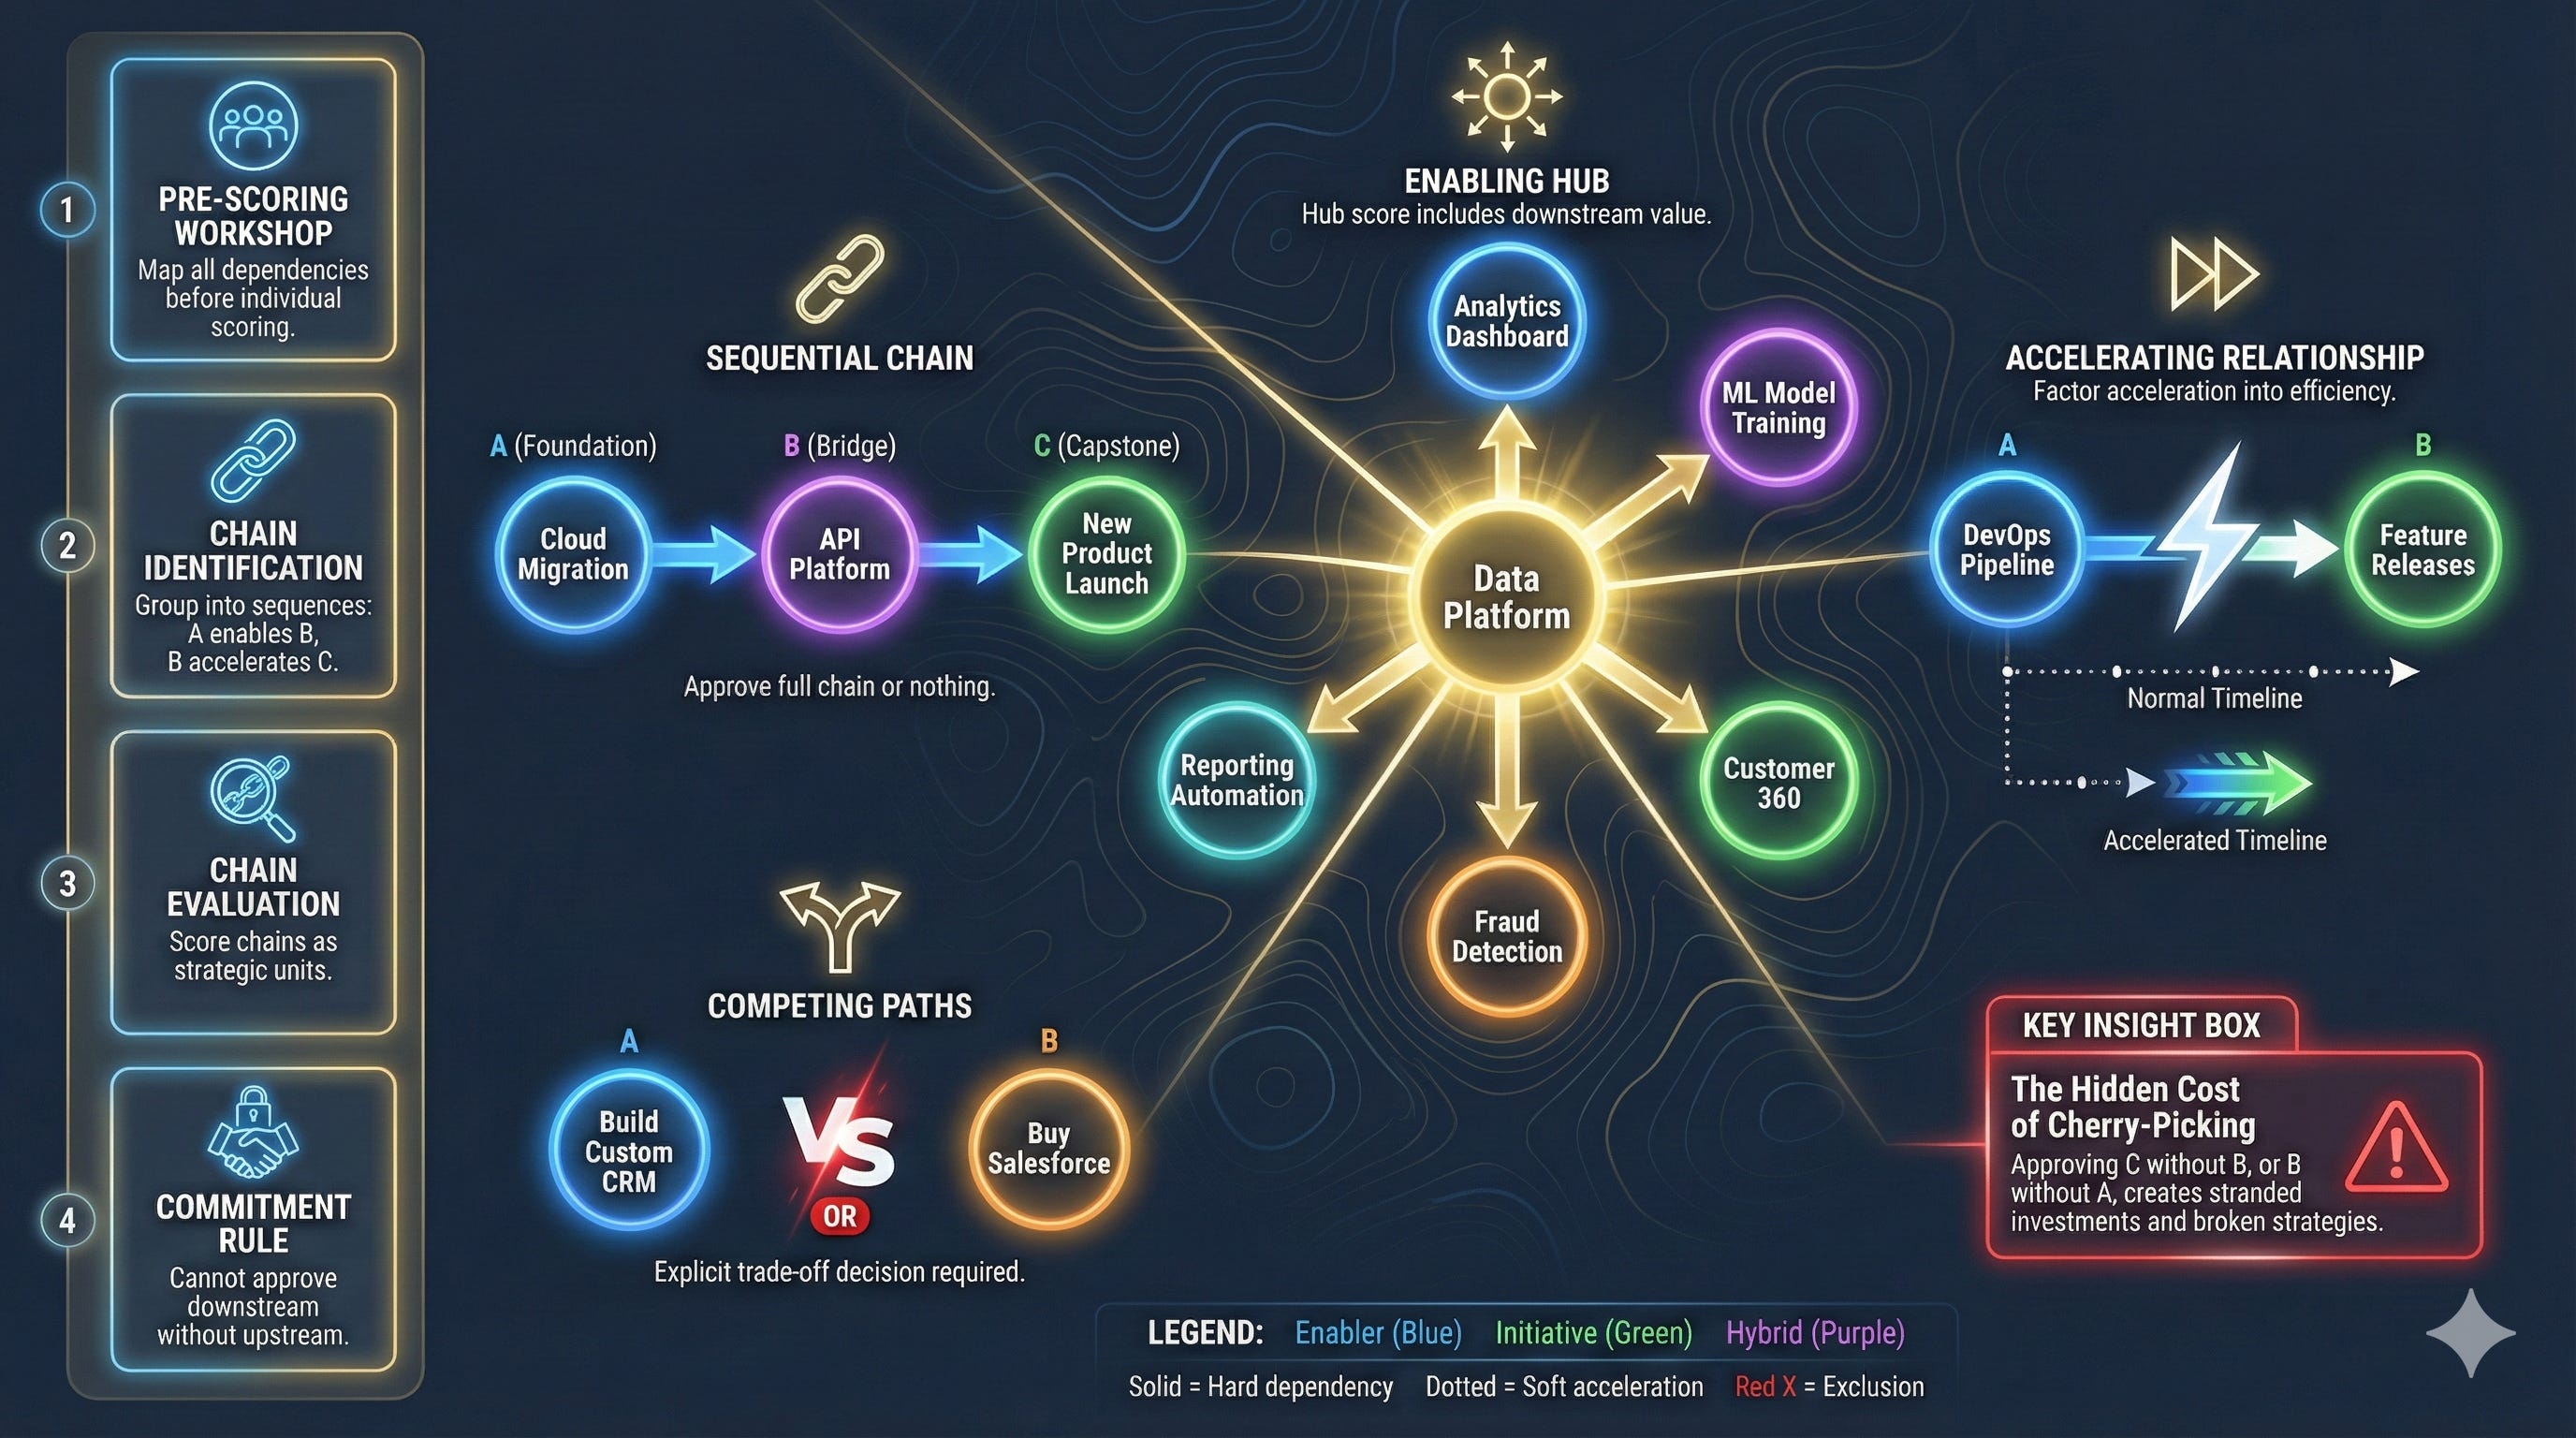
The Implication
Chain mapping transforms portfolio management from a collection of individual decisions into a strategic sequencing exercise. It prevents the common pathology of approving attractive downstream projects while neglecting the enablers they require.
Portfolio Archetype Declaration
The Problem
Portfolio decisions are often made bottom-up: score projects, rank them, fund from the top until budget exhausts. This approach assumes that the optimal portfolio emerges from aggregating optimal individual decisions. It does not.
The Solution
Before scoring individual projects, leadership declares a portfolio archetype, an explicit choice about portfolio composition.
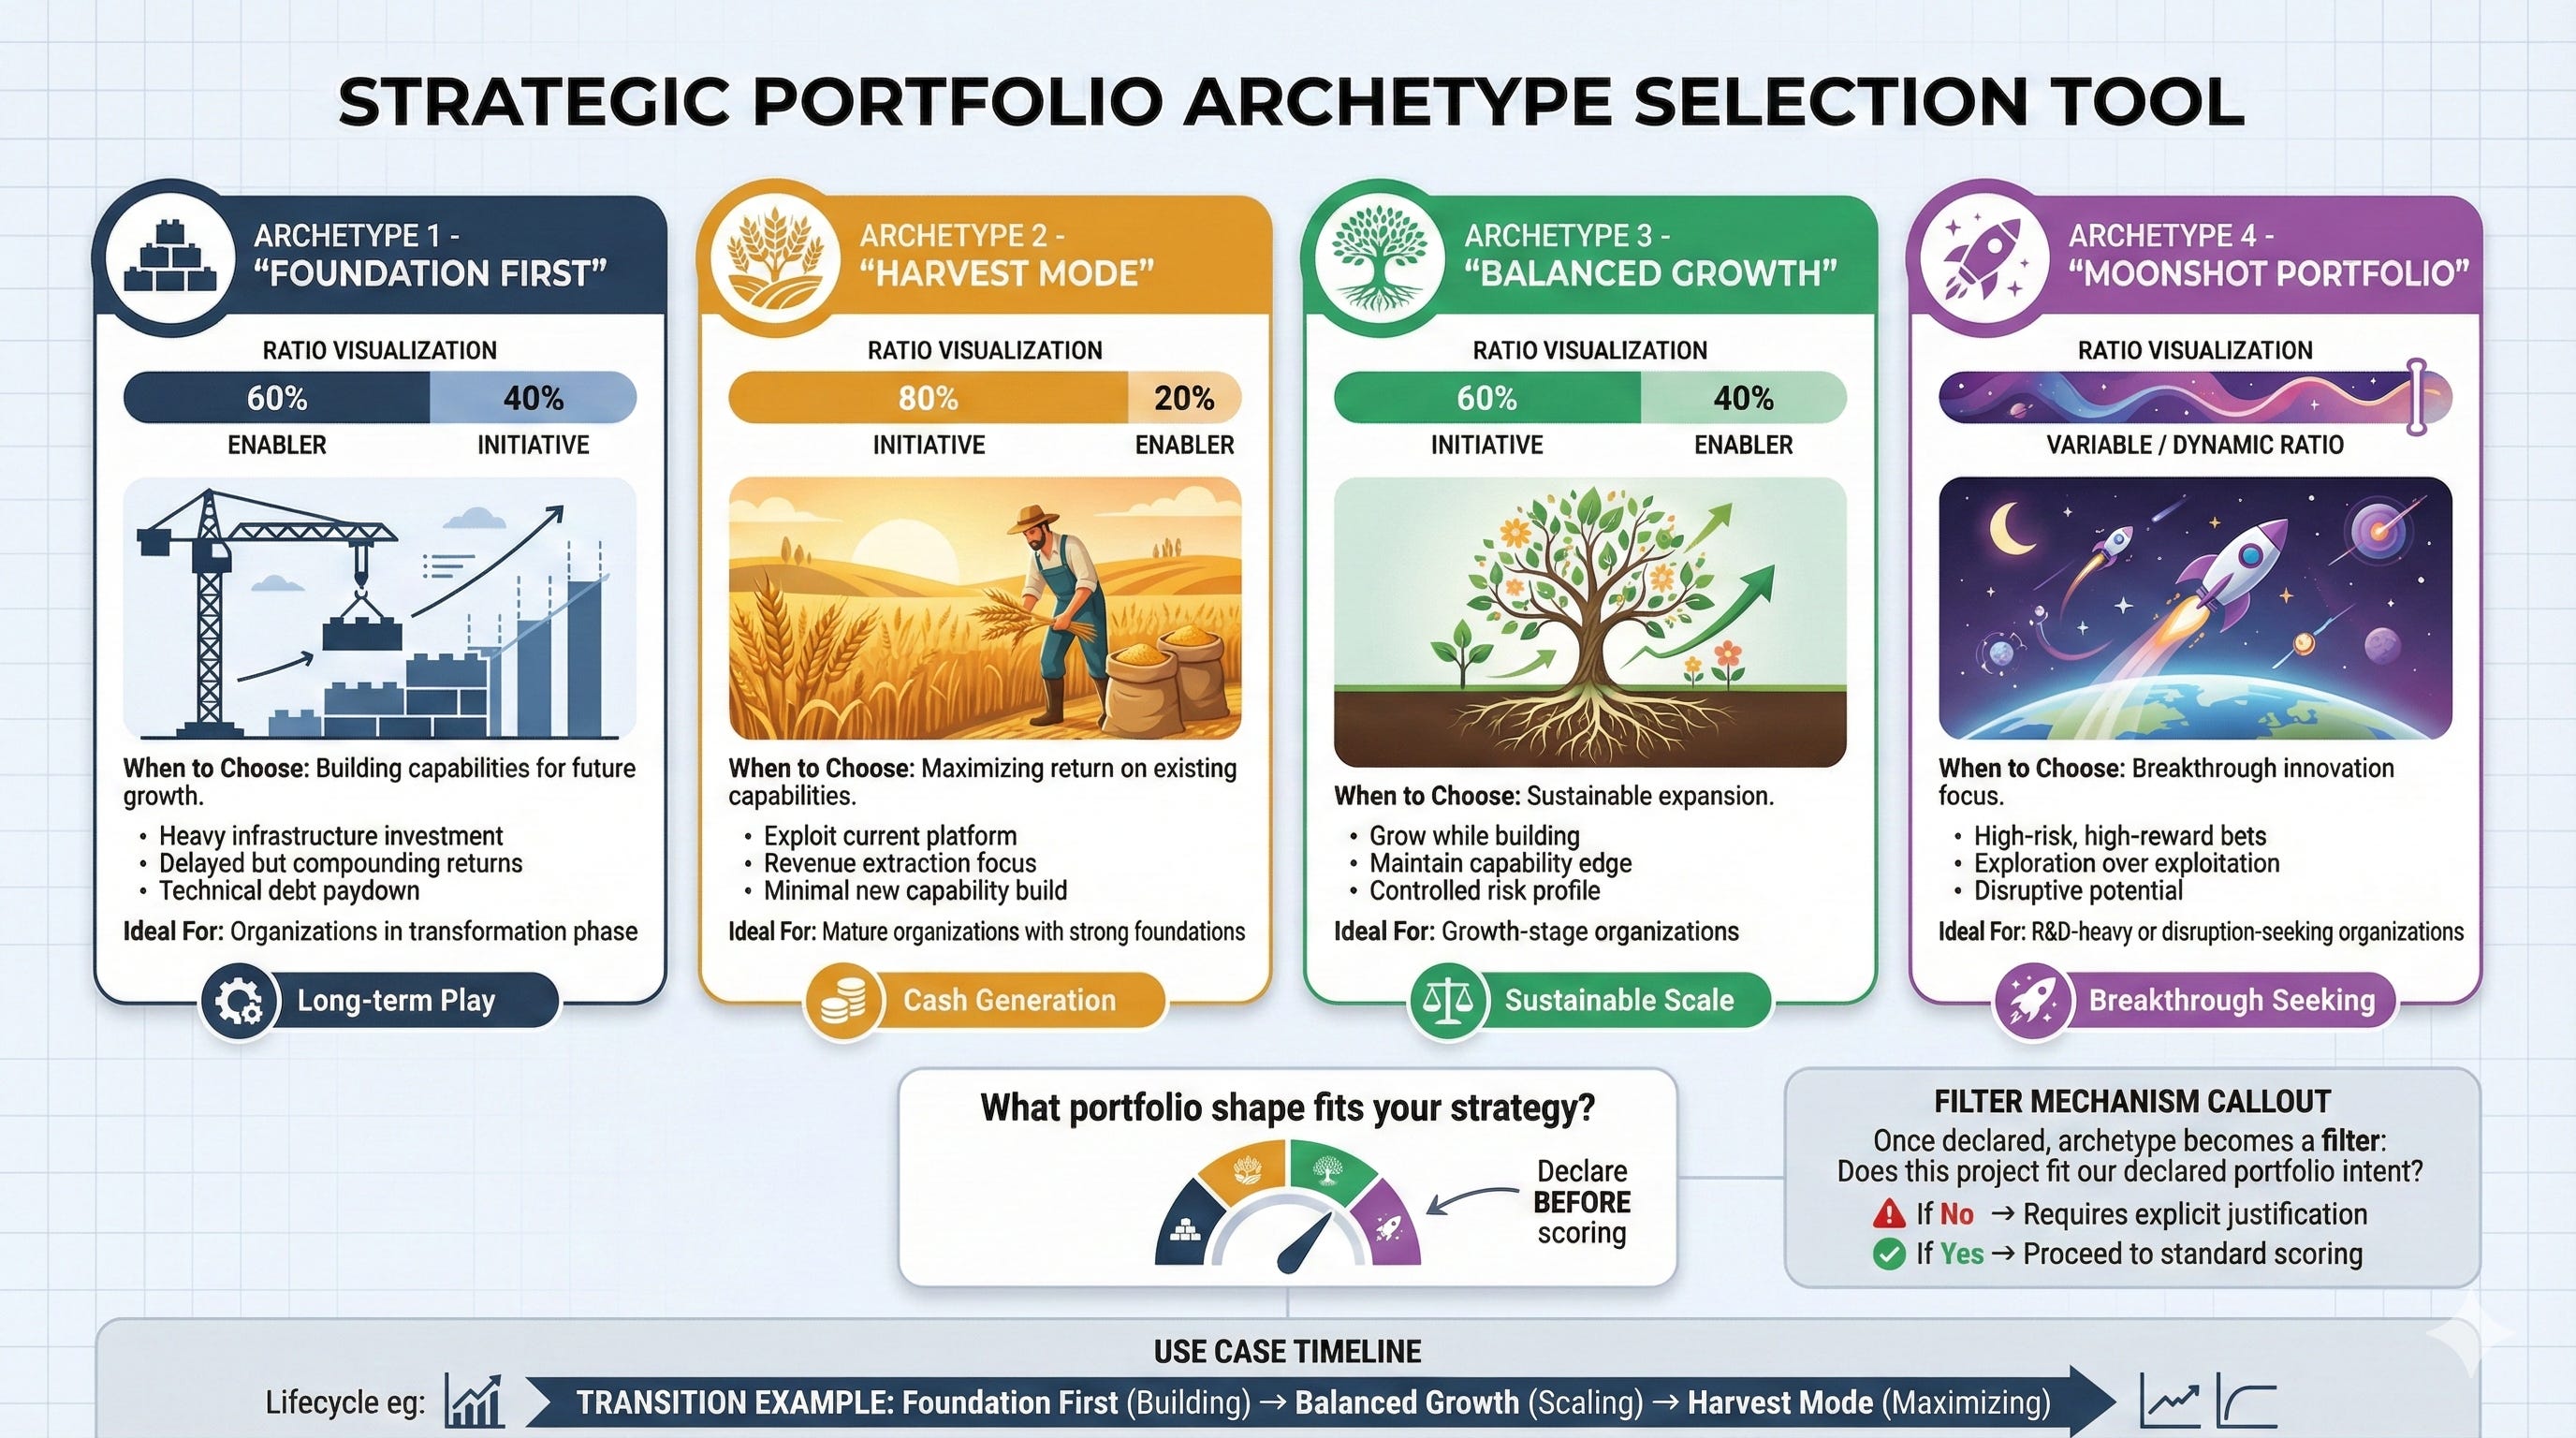
Foundation First (60% Enabler, 40% Initiative): The organization is building capability for future growth. Heavy infrastructure investment, technical debt reduction, platform development. Returns are delayed but compound.
Harvest Mode (20% Enabler, 80% Initiative): The organization has strong foundations and is maximizing return on existing capabilities. Revenue extraction, market penetration, customer expansion. Minimal new capability investment.
Balanced Growth (40% Enabler, 60% Initiative): The organization seeks sustainable expansion. Growth while building, maintaining capability edge without sacrificing current returns.
Moonshot Portfolio (variable composition): The organization prioritizes breakthrough innovation. High-risk bets, exploration over exploitation, disruptive potential.
After declaration, the archetype becomes a filter. Projects that align with the declared intent proceed normally. Projects that conflict require explicit justification, not prohibition, but transparent exception handling.
The Implication
Archetype declaration prevents the emergence of an accidental portfolio. Without it, Initiative projects, which are easier to justify with traditional ROI arguments, inevitably crowd out Enablers. The organization ends up with a portfolio that reflects political power rather than strategic intent.
The Dual Regret Protocol
The Problem
The standard Regret Score asks: “What if we do not do this?” This framing is vulnerable to cultural bias. Risk-averse organizations systematically underscore bold moves, rating everything as low-regret because action feels dangerous. The score becomes an echo chamber for organizational conservatism.
The Solution
The Dual Regret Protocol scores both dimensions separately.
Regret of Omission: What if we do not do this? The standard question, capturing missed opportunity and competitive threat.
Regret of Commission: What if we do this and it fails? The inverted question, capturing downside risk and sunk cost exposure.
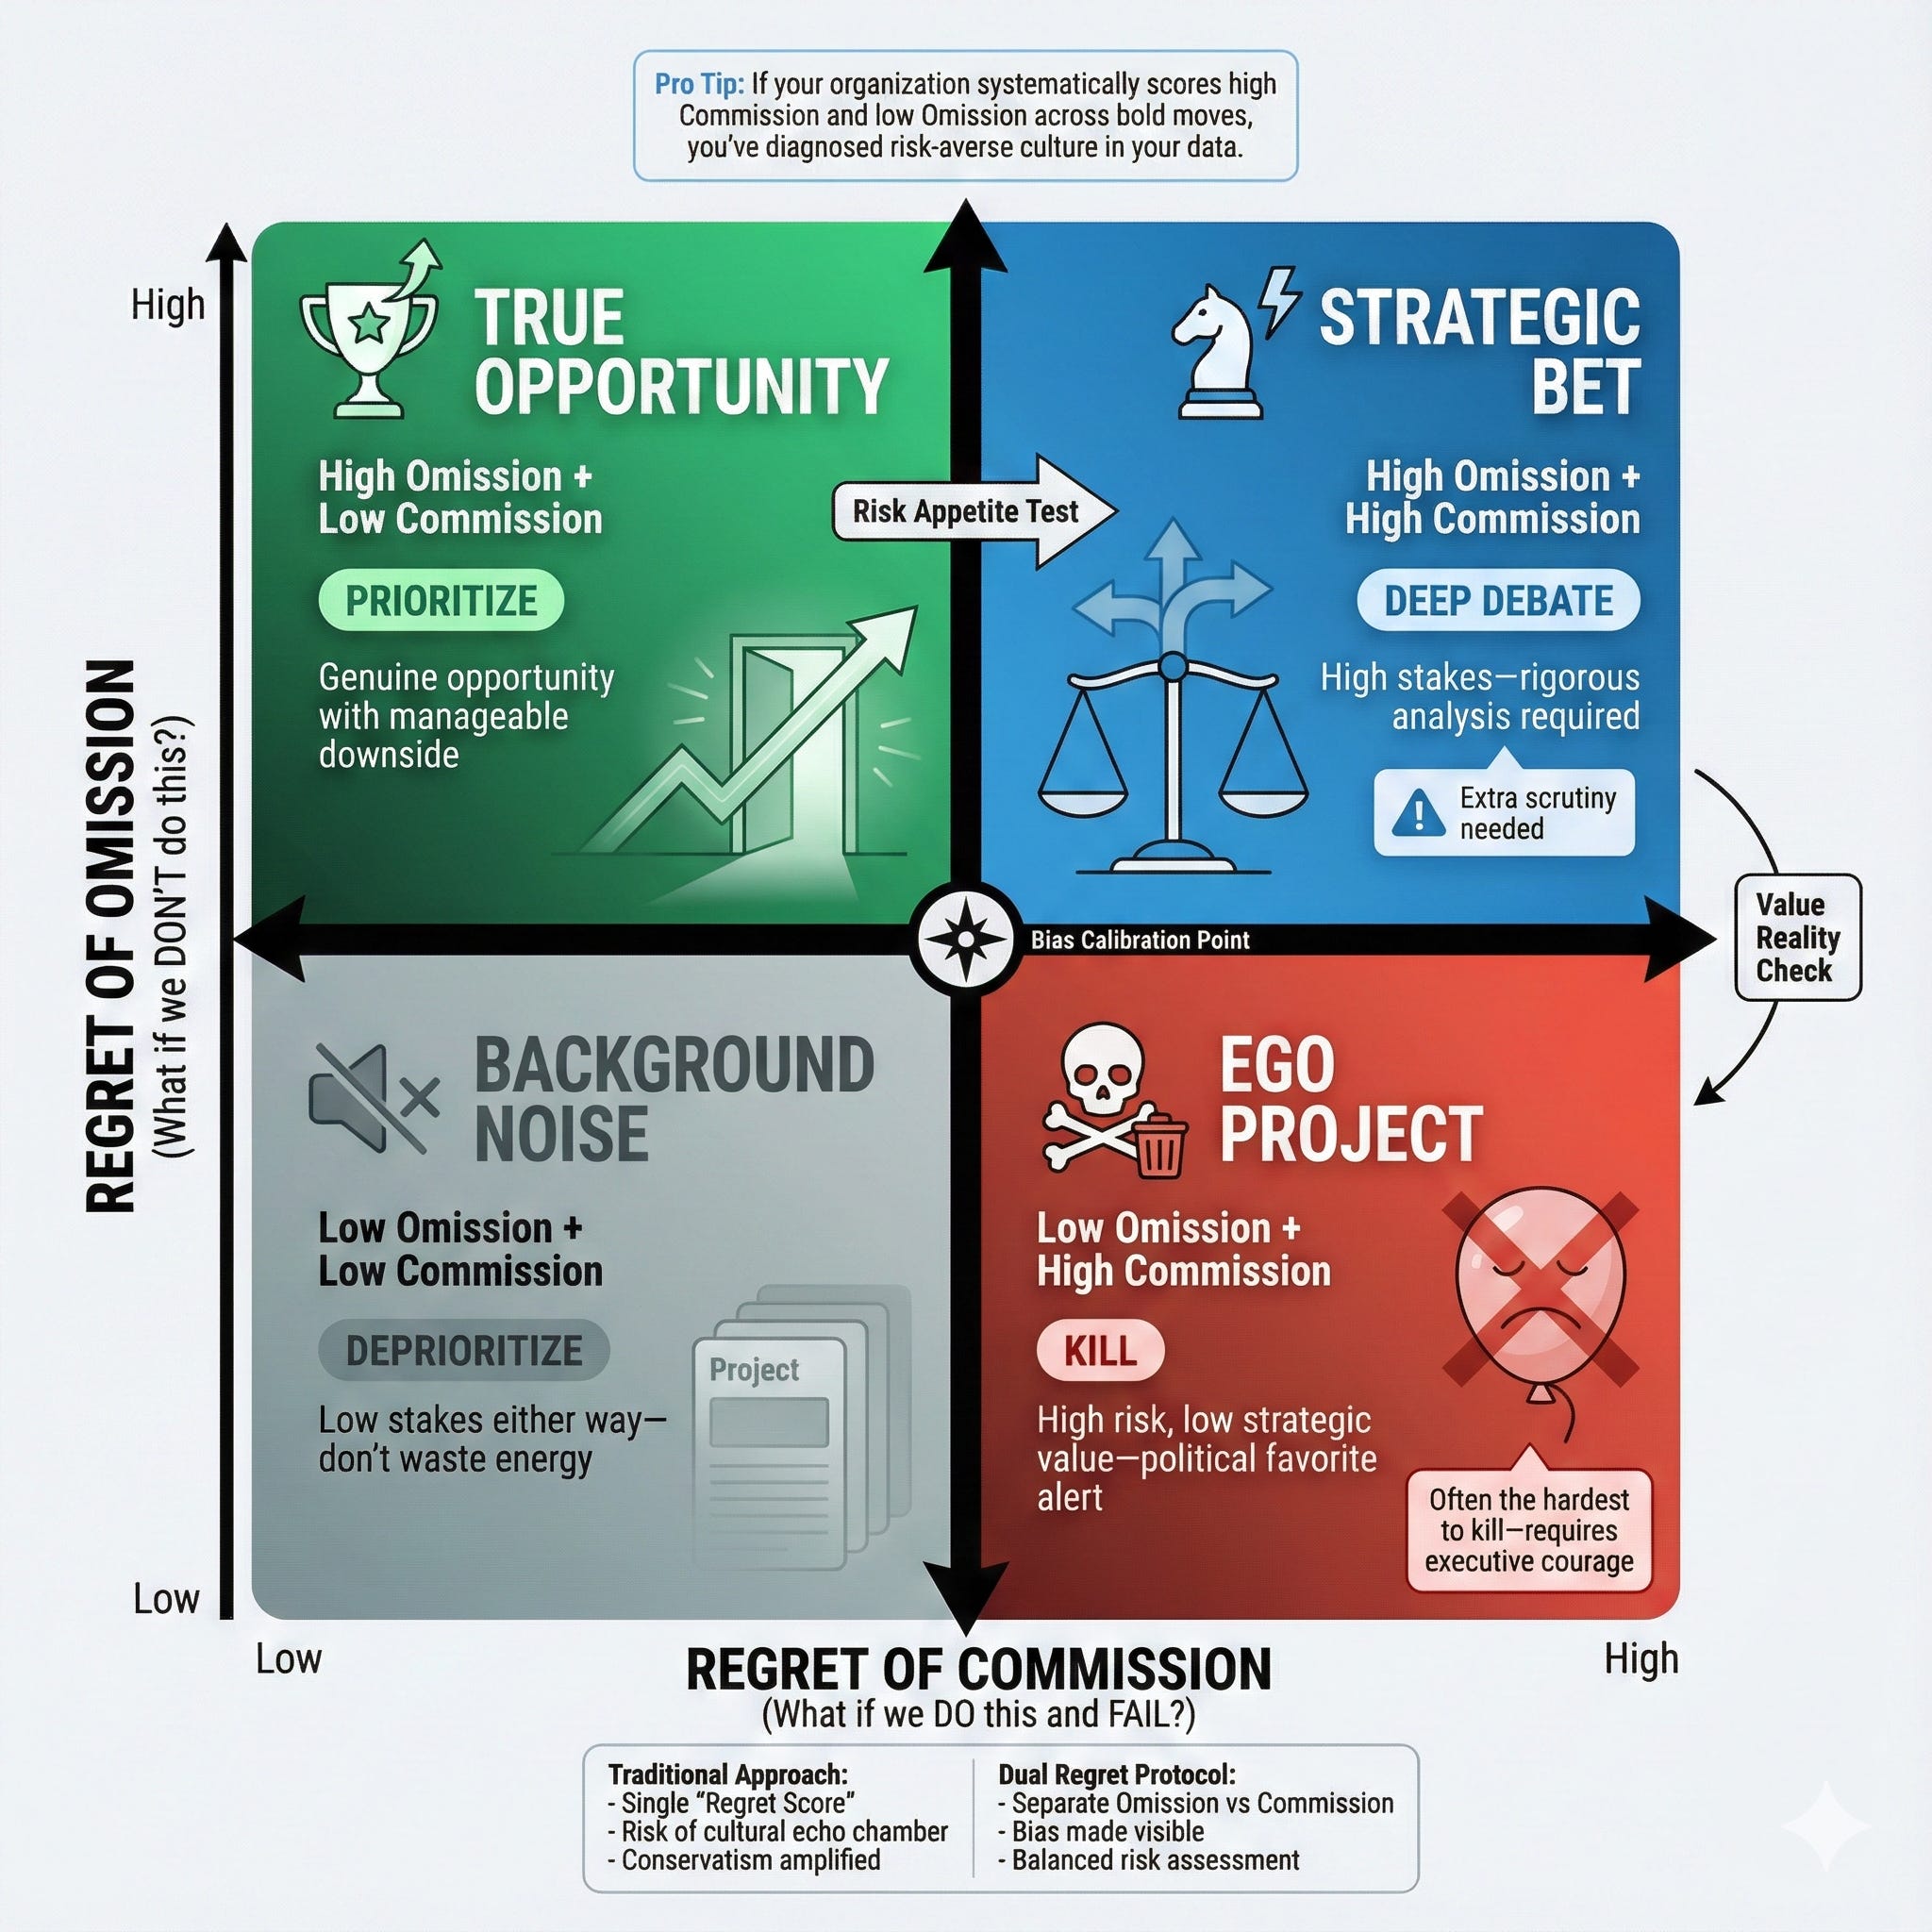
The combination reveals four profiles:
True Opportunities (High Omission, Low Commission): Genuine upside with manageable downside. These projects deserve priority.
Strategic Bets (High Omission, High Commission): High stakes on both sides. These projects require rigorous debate, explicit de-risking, and milestone-based commitment.
Ego Projects (Low Omission, High Commission): High risk without strategic necessity. Often political favorites or innovation theater. These projects should be killed.
Background Noise (Low Omission, Low Commission): Low stakes either way. These projects deserve minimal attention.
The Implication
Organizations that systematically score high Commission and low Omission across bold initiatives have diagnosed their own cultural risk aversion in their data. The Dual Regret Protocol makes organizational psychology visible and discussable.
Pre-Mortem Anchoring
The Problem
Strategic dimensions (Strategy Fit, Optionality, Regret) are inherently abstract. Without grounding, scores drift toward central tendency, everything becomes a 3. The framework loses discriminating power.
The Solution
The Pre-Mortem Protocol uses scenario projection to ground abstract scoring in concrete imagination.
For each major project, the scoring team spends 15 minutes on two scenarios.
Failure Scenario: “It is 2027. This project failed catastrophically. The board is asking questions. What happened?”
The team brainstorms failure modes, market shifts, technical complexity, resource insufficiency, competitive moves, dependency failures. These concrete scenarios calibrate the Regret-of-Commission score.
Success Scenario: “It is 2027. This project exceeded all expectations. We are presenting it as a case study. What did we do right?”
The team identifies critical success factors, early alignment, iterative de-risking, team composition, timing. These ground the Regret-of-Omission score and inform execution planning.
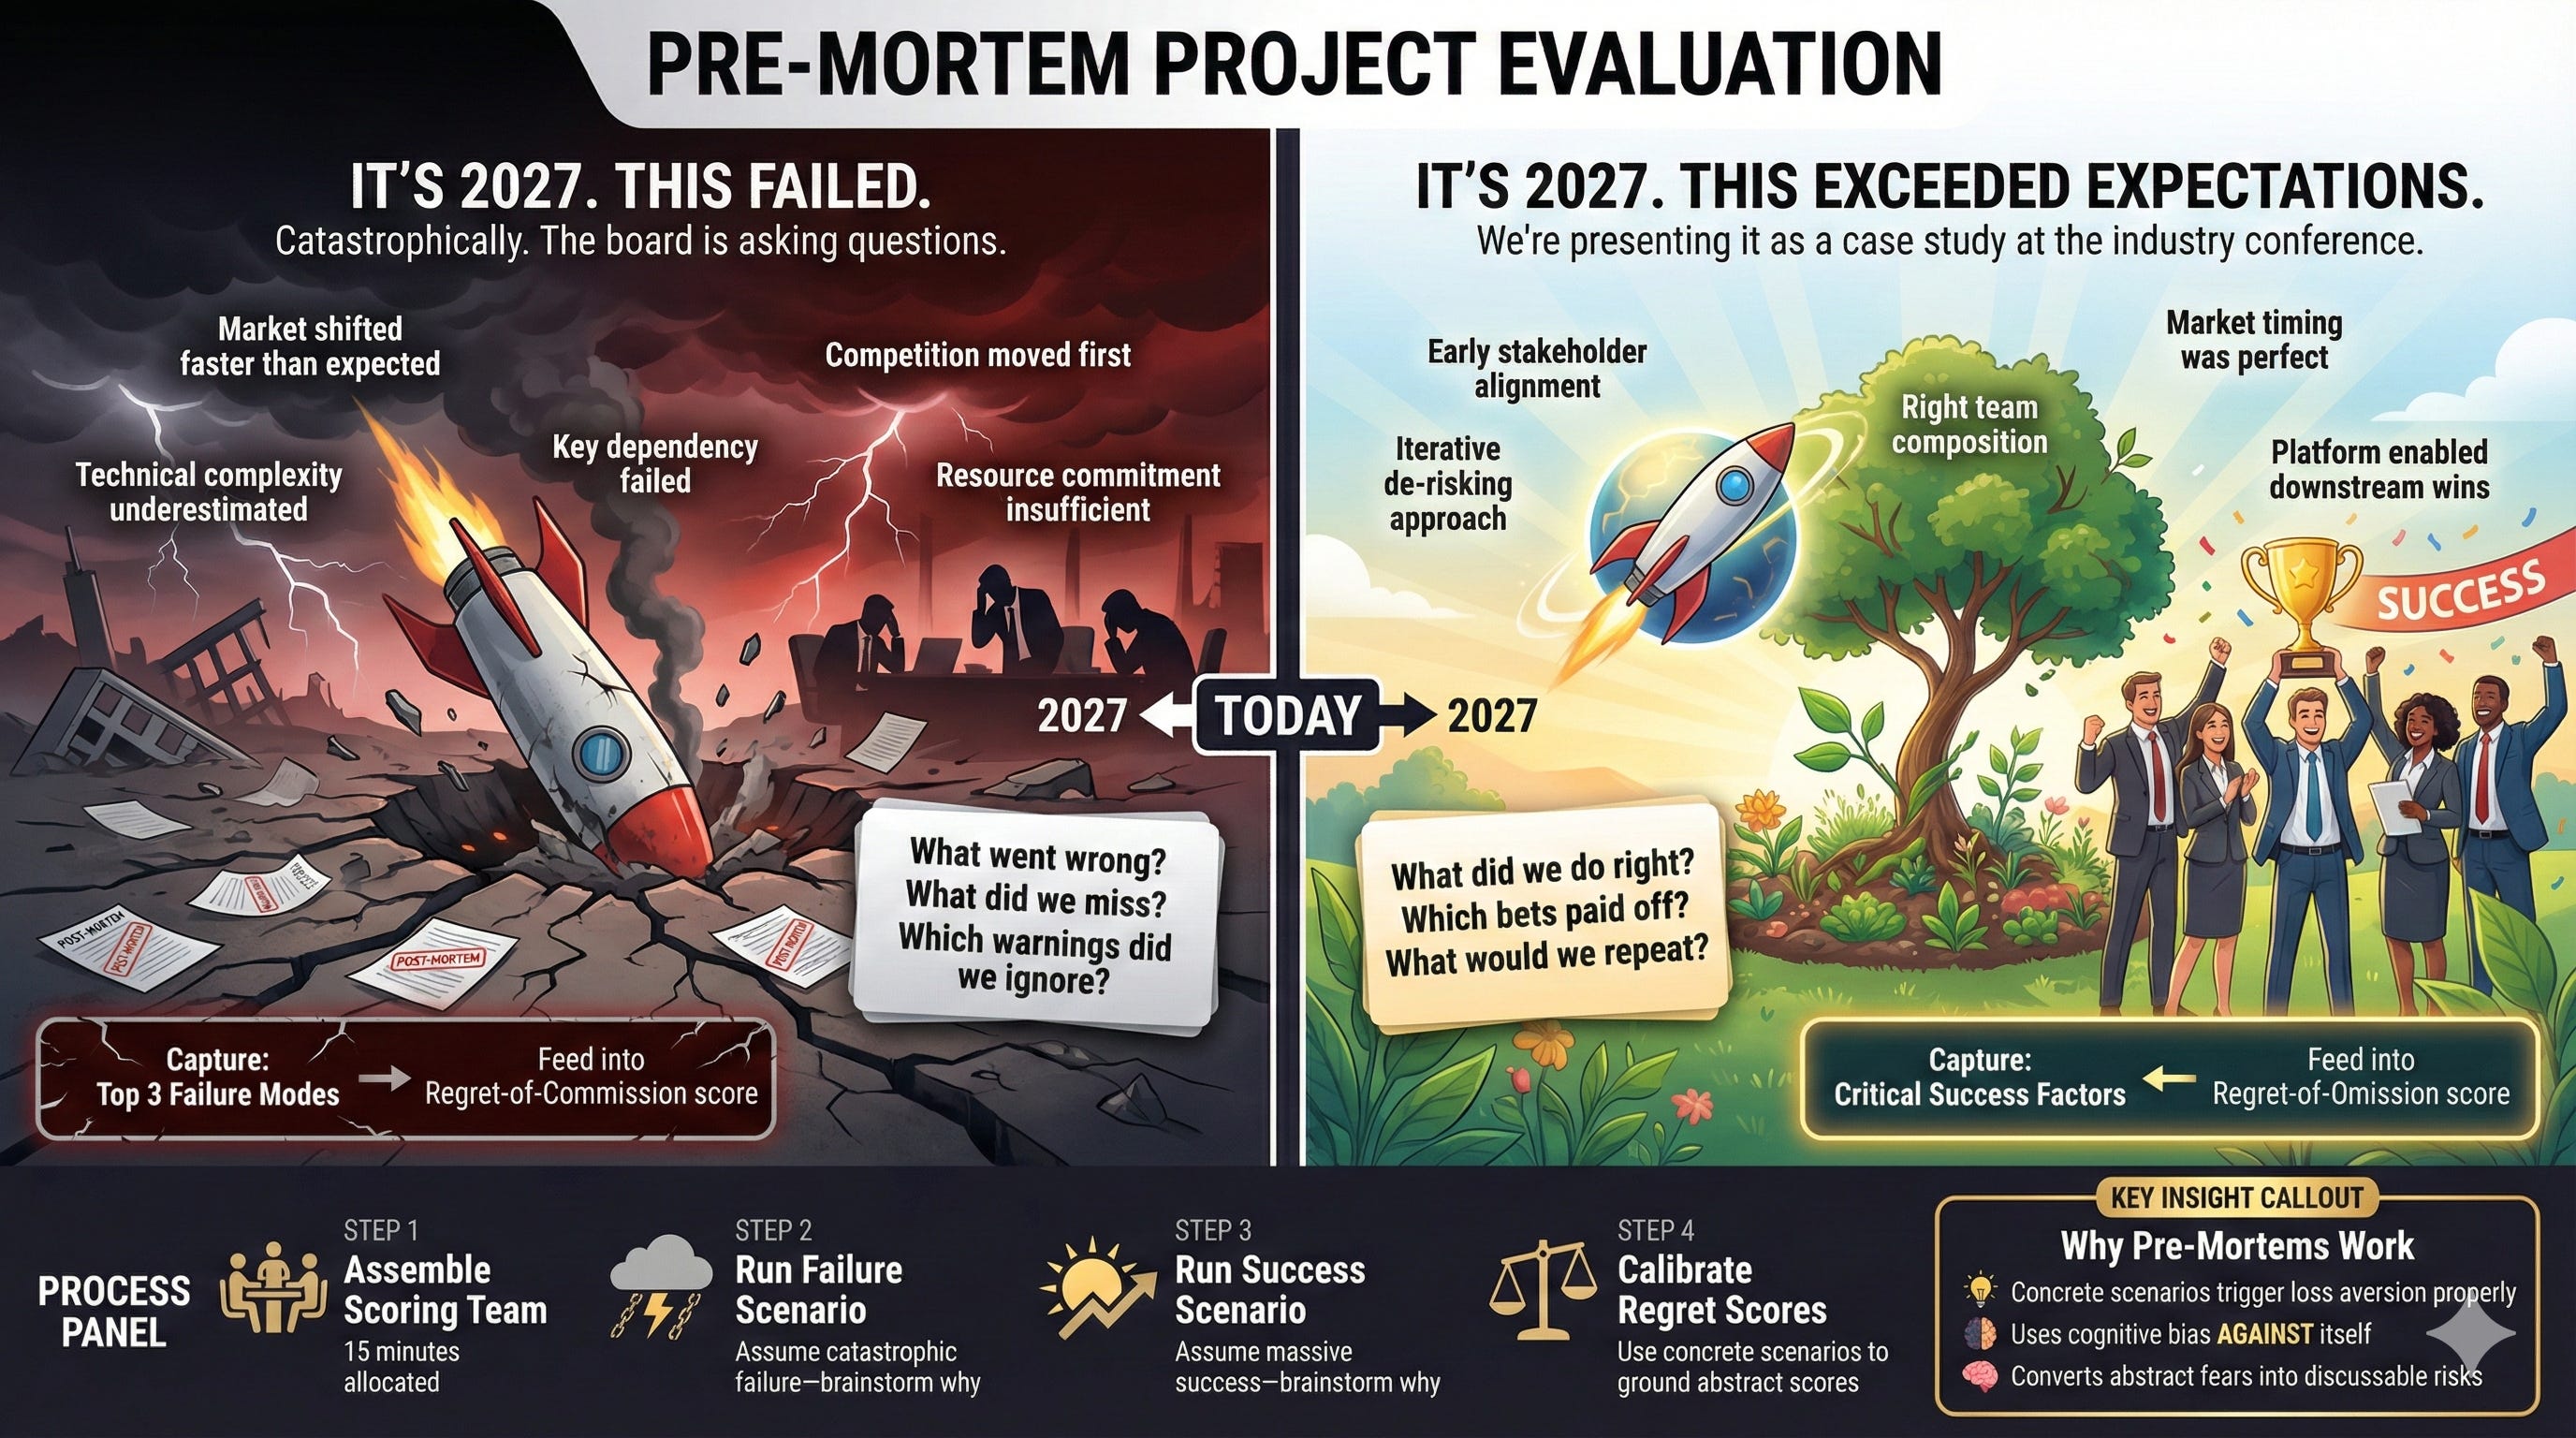
The Implication
Pre-mortems use cognitive bias against itself. Loss aversion, properly triggered, surfaces risks that abstract scoring obscures. The exercise converts organizational anxiety into explicit, actionable discussion.
External Calibration
The Problem
Internal scoring teams share assumptions, blind spots, and cultural biases. Homogeneous groups produce homogeneous scores. Echo chambers masquerade as consensus.
The Solution
External calibration introduces outside perspective into the scoring process.
The scoring team includes three internal stakeholders plus one or two external voices, board advisors, industry peers, external consultants. All participants score independently before discussion. Variance analysis compares distributions.
If internal scores cluster conservatively while external scores diverge upward, the organization has surfaced its own risk aversion. If external scorers consistently rate Optionality higher, internal teams may be discounting future value.
For the Regret Score specifically, external voices are particularly valuable. They carry reference class knowledge: what did organizations like yours regret? What opportunities did peers miss? What bets paid off unexpectedly?
The Implication
External calibration breaks cultural insularity. It does not replace internal judgment. Stakeholders understand their own context. But it provides a mirror, reflecting assumptions that internal teams take for granted.
Part V: Implementation
The Scoring Workflow
Implementation follows a structured sequence designed to maximize framework value while minimizing bureaucratic overhead.
Phase 1: Portfolio Setup
Before any individual project scoring occurs, leadership addresses portfolio-level questions.
First, declare the Portfolio Archetype. This is not a default, it is an explicit decision about portfolio shape that reflects strategic context. Foundation First for transformation, Harvest Mode for optimization, Balanced Growth for sustainable expansion, Moonshot for breakthrough innovation.
Second, conduct Project Chain Mapping. A facilitated workshop identifies dependencies, enabling relationships, and competing alternatives. The output is a portfolio topology that informs subsequent scoring.
Third, establish the External Calibration panel. Identify one or two external voices who will participate in scoring advisors, board members, or industry peers with relevant perspective.
Phase 2: Project Scoring
With portfolio context established, individual projects proceed through the scoring process.
Each project is classified as Initiative or Enabler based on its primary value mechanism. This classification determines which formula applies.
For each project, the scoring team (internal stakeholders plus external calibrators) independently rates the three core dimensions: Strategy Fit, Optionality, and Regret Score. If using the Dual Regret Protocol, Omission and Commission are scored separately.
For major projects, the Pre-Mortem Protocol precedes final scoring. The failure and success scenarios ground abstract dimensions in concrete imagination.
After independent scoring, variance analysis identifies divergence. Significant gaps, particularly between internal and external scorers, trigger discussion before consensus.
Phase 3: Matrix Population
Scored projects are positioned on the Strategic Portfolio Matrix.
The vertical axis reflects Strategic Value, calculated using the appropriate formula for each project type. The horizontal axis reflects Efficiency, relating adjusted value to implementation effort. Bubble size encodes risk level.
The Downstream Value Coefficient, if applied, modifies base scores before matrix positioning. Platform projects with high DVC shift upward appropriately.
Phase 4: Portfolio Review
With all projects positioned, the matrix reveals portfolio composition.
Compare actual composition to declared archetype. If Foundation First was declared but the matrix shows overwhelming Initiative concentration, the organization has identified a gap between intent and allocation.
Examine quadrant distribution. Healthy portfolios show representation appropriate to strategic context, neither pure Strategic Bets nor pure Quick Wins.
Review chain integrity. For approved projects with dependencies, verify that enabling projects are also approved. Do not strand investments by approving downstream without committing to upstream.
Phase 5: Decision and Commitment
Matrix position guides but does not dictate decisions.
No Brainers proceed to resourcing. Strategic Bets proceed to de-risking planning and phased commitment. Quick Wins batch for efficient execution. Money Pits face kill-or-transform decisions.
For Strategic Bets specifically, approval includes explicit de-risking requirements, prototype phases, milestone gates, contingency plans. The organization commits to the bet while maintaining strategic flexibility.
Common Pitfalls
Frameworks fail in implementation, not design. The following patterns undermine Strategic Portfolio Framework value:
Scoring Without Pre-Work: Skipping portfolio archetype declaration and chain mapping reduces the framework to a sophisticated spreadsheet. The strategic context that gives scores meaning is lost.
Formula Fetishism: Treating formula outputs as definitive rather than indicative. The numbers inform judgment; they do not replace it. A project with a score of 3.7 is not objectively superior to one with 3.5.
Political Override Without Transparency: Approving projects that the framework deprioritizes without acknowledging the departure. Overrides are legitimate; hidden overrides are corrosive. When leadership approves a Money Pit for strategic reasons the framework does not capture, that reasoning should be explicit.
Enabler Starvation: Allowing Initiatives to crowd out Enablers despite archetype declaration. This reflects a failure to treat the archetype as genuinely binding.
Infrequent Recalibration: Treating framework outputs as permanent. Strategic context shifts; new information emerges; market conditions change. Portfolios require regular re-evaluation, not one-time scoring.
Conclusion: The Framework as Strategic Discipline
The Strategic Portfolio Framework does not eliminate difficult decisions. It surfaces them.
Organizations that adopt this framework will still face trade-offs, resource constraints, and uncertainty. They will still disagree about strategic direction and project priority. They will still make mistakes.
What changes is the quality of the conversation.
Instead of debating which project has a more impressive ROI projection, a comparison that rewards financial creativity over strategic clarity, the organization debates strategic fit, optionality value, and regret exposure. Instead of treating all projects as equivalent, the organization distinguishes between Initiatives that drive revenue and Enablers that create capability. Instead of evaluating projects in isolation, the organization maps dependencies and chain dynamics.
The framework makes visible what is usually hidden: the assumptions behind prioritization, the trade-offs between present returns and future flexibility, the difference between genuine strategic bets and expensive ego projects.
In doing so, it creates accountability. When a project is approved over others, the rationale is documented in its scores. When a portfolio tilts away from its declared archetype, the deviation is measurable. When political power overrides strategic logic, the framework makes that override visible.
This visibility is the framework’s ultimate value. Not optimization, no framework optimizes genuinely uncertain futures. Not objectivity, human judgment remains essential at every step. But transparency. The discipline of articulating, quantifying, and defending the choices that shape organizational trajectory.
Portfolio decisions are strategic decisions. They deserve strategic rigor.
“No framework eliminates politics. But a good framework makes political maneuvers visible.”
Appendix: Quick Reference
Scoring Scales Summary
Dimension Score 5 Score 3 Score 1 Strategy Fit Directly enables top priority Moderate alignment No strategic connection Optionality Opens 5+ future pathways Opens 1-2 pathways Closes options Regret Score Catastrophic if not done Meaningful opportunity cost No regret expected DVC Platform play: 5+ projects Moderate enablement Terminal project
Formula Reference
Initiative: Strategic Value = (Strategy Fit × 0.40) + (Optionality × 0.25) + (Regret × 0.35)
Enabler: Strategic Value = (Strategy Fit × 0.30) + (Optionality × 0.45) + (Regret × 0.25)
DVC Modifier: Final Score = Base Score × (1 + (DVC - 1) × 0.15)
Quadrant Actions
Quadrant Profile Action No Brainers High Value + High Efficiency Execute immediately, resource fully Strategic Bets High Value + Low Efficiency Debate rigorously, de-risk explicitly Quick Wins Low Value + High Efficiency Batch, delegate, automate Money Pits Low Value + Low Efficiency Kill or transform